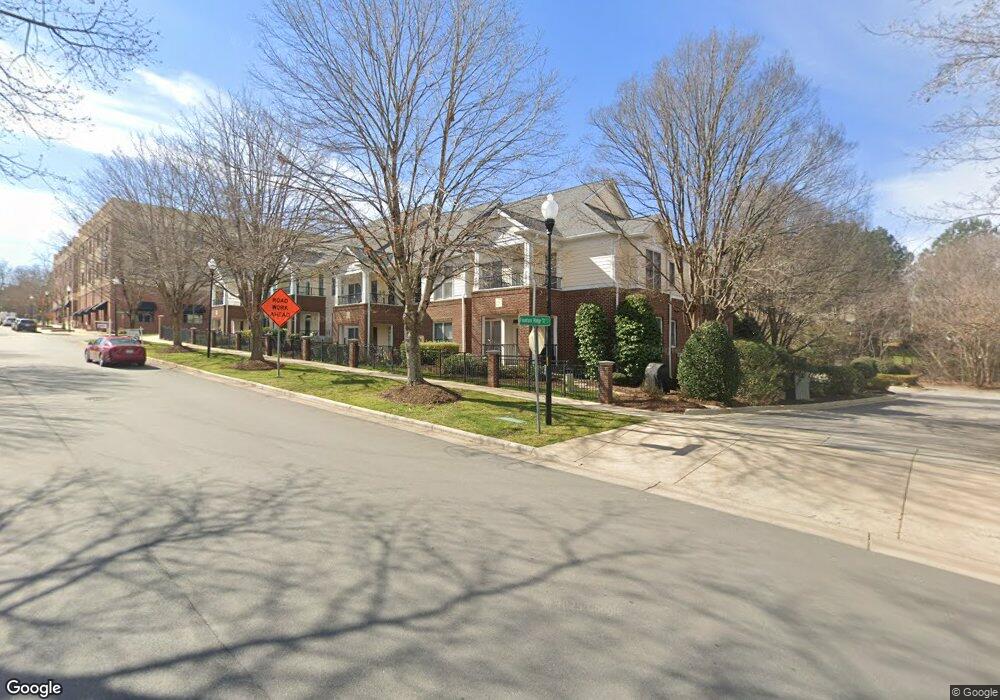
115 Fountain Ridge Place Unit 115 Holly Springs, NC 27540
Estimated Value: $218,000 - $259,000
1
Bed
2
Baths
800
Sq Ft
$289/Sq Ft
Est. Value
About This Home
This home is located at 115 Fountain Ridge Place Unit 115, Holly Springs, NC 27540 and is currently estimated at $231,326, approximately $289 per square foot. 115 Fountain Ridge Place Unit 115 is a home located in Wake County with nearby schools including Holly Springs Elementary School, Holly Ridge Middle School, and Holly Springs High School.
Ownership History
Date
Name
Owned For
Owner Type
Purchase Details
Closed on
Jun 3, 2016
Sold by
Keith Christopher H
Bought by
Duke Wallace Arrington
Current Estimated Value
Home Financials for this Owner
Home Financials are based on the most recent Mortgage that was taken out on this home.
Original Mortgage
$55,000
Outstanding Balance
$4,841
Interest Rate
3.58%
Mortgage Type
New Conventional
Estimated Equity
$226,485
Purchase Details
Closed on
Dec 19, 2013
Sold by
Blackwell Daphne
Bought by
Keith Christopher H
Home Financials for this Owner
Home Financials are based on the most recent Mortgage that was taken out on this home.
Original Mortgage
$84,693
Interest Rate
4.25%
Mortgage Type
New Conventional
Purchase Details
Closed on
Feb 5, 2002
Sold by
Darby Builders Inc
Bought by
Blackwell Daphne
Home Financials for this Owner
Home Financials are based on the most recent Mortgage that was taken out on this home.
Original Mortgage
$92,000
Interest Rate
7.12%
Create a Home Valuation Report for This Property
The Home Valuation Report is an in-depth analysis detailing your home's value as well as a comparison with similar homes in the area
Home Values in the Area
Average Home Value in this Area
Purchase History
| Date | Buyer | Sale Price | Title Company |
|---|---|---|---|
| Duke Wallace Arrington | $105,500 | None Available | |
| Keith Christopher H | $83,000 | None Available | |
| Blackwell Daphne | $90,000 | -- |
Source: Public Records
Mortgage History
| Date | Status | Borrower | Loan Amount |
|---|---|---|---|
| Open | Duke Wallace Arrington | $55,000 | |
| Previous Owner | Keith Christopher H | $84,693 | |
| Previous Owner | Blackwell Daphne | $92,000 |
Source: Public Records
Tax History Compared to Growth
Tax History
| Year | Tax Paid | Tax Assessment Tax Assessment Total Assessment is a certain percentage of the fair market value that is determined by local assessors to be the total taxable value of land and additions on the property. | Land | Improvement |
|---|---|---|---|---|
| 2025 | $2,046 | $235,467 | -- | $235,467 |
| 2024 | $2,038 | $235,467 | $0 | $235,467 |
| 2023 | $1,477 | $135,051 | $0 | $135,051 |
| 2022 | $1,426 | $135,051 | $0 | $135,051 |
| 2021 | $1,400 | $135,051 | $0 | $135,051 |
| 2020 | $1,400 | $135,051 | $0 | $135,051 |
| 2019 | $1,216 | $99,394 | $0 | $99,394 |
| 2018 | $1,100 | $99,394 | $0 | $99,394 |
| 2017 | $1,061 | $99,394 | $0 | $99,394 |
| 2016 | $1,047 | $99,394 | $0 | $99,394 |
| 2015 | $1,010 | $94,322 | $0 | $94,322 |
| 2014 | $975 | $94,322 | $0 | $94,322 |
Source: Public Records
Map
Nearby Homes
- 215 Savannah Ridge Rd Unit 215
- 305 Savannah Ridge Rd
- 124 Kingsport Rd
- 0/416 Holly Springs Rd
- 204 Crossway Ln
- 4924 Gable Ridge Ln
- 104 Crossway Ln
- 4809 Greenpoint Ln
- 129 Starwood Ln
- 5120 Linksland Dr
- 108 Warm Wood Ln
- 228 Masden Rd
- 201 Seagraves Creek Ln
- 225 Old Ride Dr
- 204 Seagraves Creek Ln
- 113 Seagraves Creek Ln
- 200 Seagraves Creek Ln
- 132 Seagraves Creek Ln
- 124 Seagraves Creek Ln
- 120 Seagraves Creek Ln
- 115 Fountain Ridge Place
- 113 Fountain Ridge Place Unit 113
- 117 Fountain Ridge Place
- 111 Fountain Ridge Place Unit 111
- 107 Fountain Ridge Place Unit 107
- 103 Fountain Ridge Place Unit 103
- 101 Fountain Ridge Place Unit 101
- 116 Fountain Ridge Place Unit 116
- 114 Fountain Ridge Place Unit 114
- 112 Fountain Ridge Place
- 110 Fountain Ridge Place Unit 110
- 106 Fountain Ridge Place
- 102 Fountain Ridge Place Unit 102
- 100 Fountain Ridge Place Unit 100
- 112 Fountain Ridge Place Unit 112
- 106 Fountain Ridge Place Unit 106
- 4908 Linksland Dr
- 4906 Linksland Dr
- 800 Savannah Ridge Rd Unit 117
- 800 Savannah Ridge Rd Unit 116