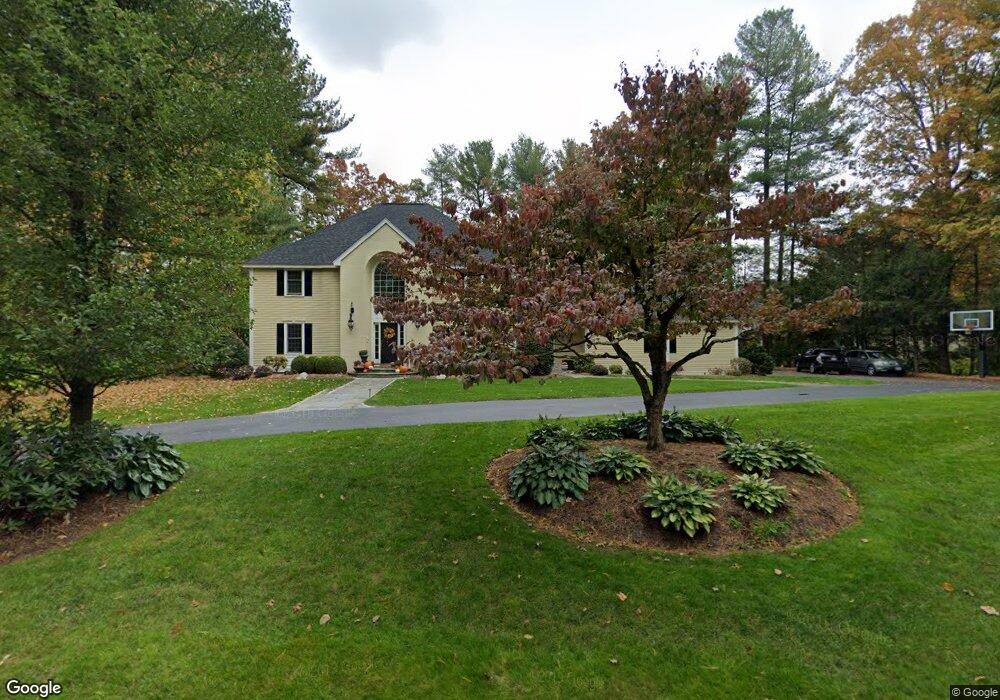
115 Fox Run Rd Sudbury, MA 01776
Estimated Value: $1,770,612 - $2,024,000
4
Beds
3
Baths
5,000
Sq Ft
$388/Sq Ft
Est. Value
About This Home
This home is located at 115 Fox Run Rd, Sudbury, MA 01776 and is currently estimated at $1,941,153, approximately $388 per square foot. 115 Fox Run Rd is a home located in Middlesex County with nearby schools including Peter Noyes Elementary School, Ephraim Curtis Middle School, and Lincoln-Sudbury Regional High School.
Ownership History
Date
Name
Owned For
Owner Type
Purchase Details
Closed on
Mar 4, 2005
Sold by
Zarella Rita M
Bought by
Madigan Marybeth G and Madigan James E
Current Estimated Value
Home Financials for this Owner
Home Financials are based on the most recent Mortgage that was taken out on this home.
Original Mortgage
$400,000
Interest Rate
5.66%
Mortgage Type
Purchase Money Mortgage
Create a Home Valuation Report for This Property
The Home Valuation Report is an in-depth analysis detailing your home's value as well as a comparison with similar homes in the area
Home Values in the Area
Average Home Value in this Area
Purchase History
| Date | Buyer | Sale Price | Title Company |
|---|---|---|---|
| Madigan Marybeth G | $1,120,000 | -- | |
| Madigan Marybeth G | $1,120,000 | -- |
Source: Public Records
Mortgage History
| Date | Status | Borrower | Loan Amount |
|---|---|---|---|
| Open | Madigan Marybeth G | $400,000 | |
| Closed | Madigan Marybeth G | $325,000 | |
| Closed | Madigan Marybeth G | $400,000 |
Source: Public Records
Tax History Compared to Growth
Tax History
| Year | Tax Paid | Tax Assessment Tax Assessment Total Assessment is a certain percentage of the fair market value that is determined by local assessors to be the total taxable value of land and additions on the property. | Land | Improvement |
|---|---|---|---|---|
| 2025 | $26,620 | $1,818,300 | $547,000 | $1,271,300 |
| 2024 | $25,578 | $1,750,700 | $531,000 | $1,219,700 |
| 2023 | $23,557 | $1,493,800 | $474,200 | $1,019,600 |
| 2022 | $22,535 | $1,248,500 | $435,000 | $813,500 |
| 2021 | $21,786 | $1,157,000 | $435,000 | $722,000 |
| 2020 | $21,347 | $1,157,000 | $435,000 | $722,000 |
| 2019 | $20,722 | $1,157,000 | $435,000 | $722,000 |
| 2018 | $20,103 | $1,121,200 | $462,600 | $658,600 |
| 2017 | $19,700 | $1,110,500 | $458,200 | $652,300 |
| 2016 | $18,802 | $1,056,300 | $440,600 | $615,700 |
| 2015 | $18,304 | $1,040,000 | $436,600 | $603,400 |
| 2014 | $18,318 | $1,016,000 | $425,000 | $591,000 |
Source: Public Records
Map
Nearby Homes
- 7 Saddle Ridge Rd
- 14 Tanbark Rd
- 21 Summer St
- 30 Rolling Ln
- 25 Bridle Path
- 89 Bridle Path
- 12 Hickory Rd
- 143 Peakham Rd
- 54 Stone Rd
- 0 Robbins Rd
- 270 Old Lancaster Rd
- 36 Old Forge Ln
- 24 Goodnow Rd
- 47 Fairbank Rd
- 0 Boston Post Rd
- 4 Elderberry Cir
- 7 Adams Rd
- 24 Woodland Rd
- 12 Camperdown Ln
- 1011 Boston Post Rd
- 39 Saddle Ridge Rd
- 109 Fox Run Rd
- 29 Saddle Ridge Rd
- 36 Saddle Ridge Rd
- 30 Saddle Ridge Rd
- 104 Fox Run Rd
- 101 Fox Run Rd
- 42 Saddle Ridge Rd
- 24 Saddle Ridge Rd
- 25 Meadowbrook Rd
- 21 Saddle Ridge Rd
- 3 Meadowbrook Rd
- 95 Fox Run Rd
- 92 Fox Run Rd
- 19 Meadowbrook Rd
- 16 Saddle Ridge Rd
- 11 Saddle Ridge Rd
- 22 Fox Run Rd
- 24 Meadowbrook Rd
- 84 Fox Run Rd