Estimated Value: $308,000 - $341,000
3
Beds
2
Baths
1,842
Sq Ft
$177/Sq Ft
Est. Value
About This Home
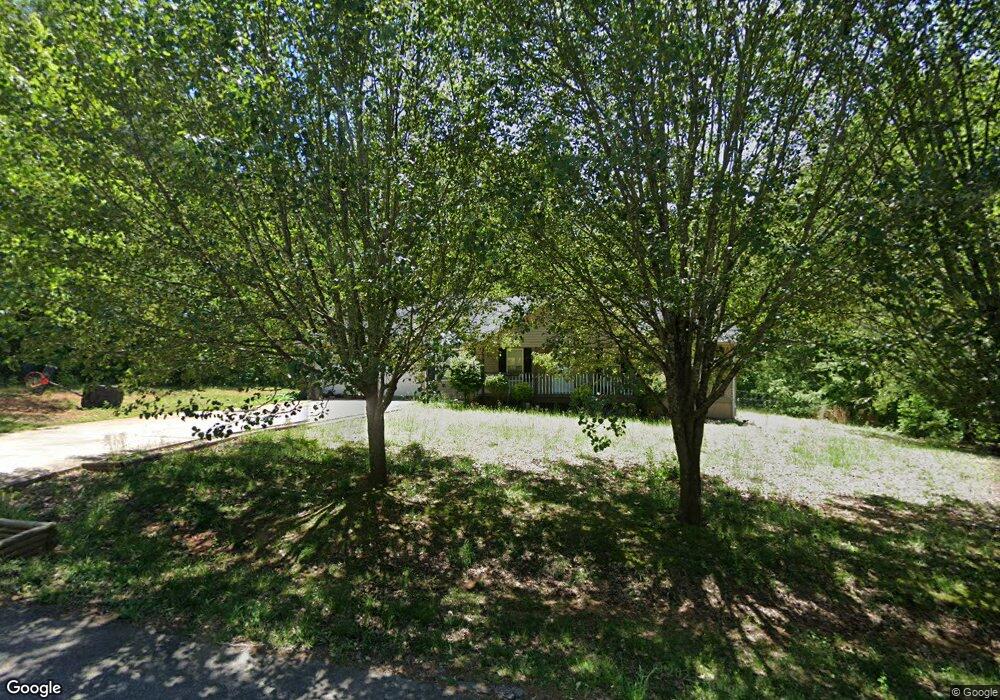
This home is located at 115 Guston St Unit 14, Alto, GA 30510 and is currently estimated at $325,638, approximately $176 per square foot. 115 Guston St Unit 14 is a home located in Habersham County with nearby schools including Baldwin Elementary School, South Habersham Middle School, and Habersham Success Academy.
Ownership History
Date
Name
Owned For
Owner Type
Purchase Details
Closed on
Mar 16, 2018
Sold by
Martinez Alejandro Sanchez
Bought by
Loggins Joshua Andrew
Current Estimated Value
Home Financials for this Owner
Home Financials are based on the most recent Mortgage that was taken out on this home.
Original Mortgage
$162,993
Outstanding Balance
$140,067
Interest Rate
4.5%
Mortgage Type
FHA
Estimated Equity
$185,571
Purchase Details
Closed on
Jun 11, 2015
Sold by
Dubose Charles E
Bought by
Martinez Alejandro Sanchez
Purchase Details
Closed on
Oct 31, 2008
Sold by
Tempel Louie Christian
Bought by
Dubose Charles E and Dubose Kathy A
Home Financials for this Owner
Home Financials are based on the most recent Mortgage that was taken out on this home.
Original Mortgage
$107,920
Interest Rate
6.11%
Mortgage Type
New Conventional
Create a Home Valuation Report for This Property
The Home Valuation Report is an in-depth analysis detailing your home's value as well as a comparison with similar homes in the area
Home Values in the Area
Average Home Value in this Area
Purchase History
| Date | Buyer | Sale Price | Title Company |
|---|---|---|---|
| Loggins Joshua Andrew | $166,000 | -- | |
| Martinez Alejandro Sanchez | $119,000 | -- | |
| Dubose Charles E | $134,900 | -- |
Source: Public Records
Mortgage History
| Date | Status | Borrower | Loan Amount |
|---|---|---|---|
| Open | Loggins Joshua Andrew | $162,993 | |
| Previous Owner | Dubose Charles E | $107,920 |
Source: Public Records
Tax History Compared to Growth
Tax History
| Year | Tax Paid | Tax Assessment Tax Assessment Total Assessment is a certain percentage of the fair market value that is determined by local assessors to be the total taxable value of land and additions on the property. | Land | Improvement |
|---|---|---|---|---|
| 2025 | $3,288 | $115,243 | $8,800 | $106,443 |
| 2024 | $2,985 | $115,012 | $8,800 | $106,212 |
| 2023 | $2,411 | $96,448 | $8,800 | $87,648 |
| 2022 | $2,186 | $83,836 | $8,800 | $75,036 |
| 2021 | $1,963 | $75,636 | $8,800 | $66,836 |
| 2020 | $1,779 | $66,132 | $8,800 | $57,332 |
| 2019 | $1,780 | $66,132 | $8,800 | $57,332 |
| 2018 | $1,479 | $55,352 | $10,400 | $44,952 |
| 2017 | $1,371 | $51,072 | $10,400 | $40,672 |
| 2016 | $1,206 | $115,600 | $7,800 | $38,440 |
| 2015 | $1,145 | $111,100 | $6,000 | $38,440 |
| 2014 | $1,135 | $108,130 | $6,000 | $37,252 |
| 2013 | -- | $43,252 | $6,000 | $37,252 |
Source: Public Records
Map
Nearby Homes
- 933 Alto Mud Creek Rd
- 3073 Gainesville Hwy
- 130 E Railroad Ave
- 1085 Smokey Rd
- 135 Oak Terrace Dr
- 117 Oak Terrace Dr
- 3568 State Route 365
- 603 Nix Rd
- 2000 Alto Mud Creek Rd
- 738 Wilbanks Rd
- 140 Highland Pointe Dr
- 2484 Apple Pie Ridge Rd Unit 11 ACRES
- 752 Dawn Place
- 2154 Apple Pie Ridge Rd
- 324 Highland Pointe Dr
- 0 State Route 365 Unit 10496178
- 0 State Route 365 Unit 10496183
- 179 Sunset Oaks Dr
- 190 Sunset Oaks Dr
- 1246 Duncan Bridge Rd
- 115 Guston St
- 109 Guston St
- 121 Guston St
- 118 Guston St
- 112 Guston St Unit 2
- 112 Guston St
- 124 Guston St
- 127 Guston St
- 0 Guston St Unit 8869167
- 0 Guston St Unit 8092619
- 0 Guston St Unit 8268737
- 0 Guston St Unit 5
- 133 Guston St
- 130 Guston St
- 130 Guston St Unit 5
- 593 Cornwall Place
- 139 Guston St Unit 10
- 139 Guston St
- 453 Cornwall Place
- 138 Guston St