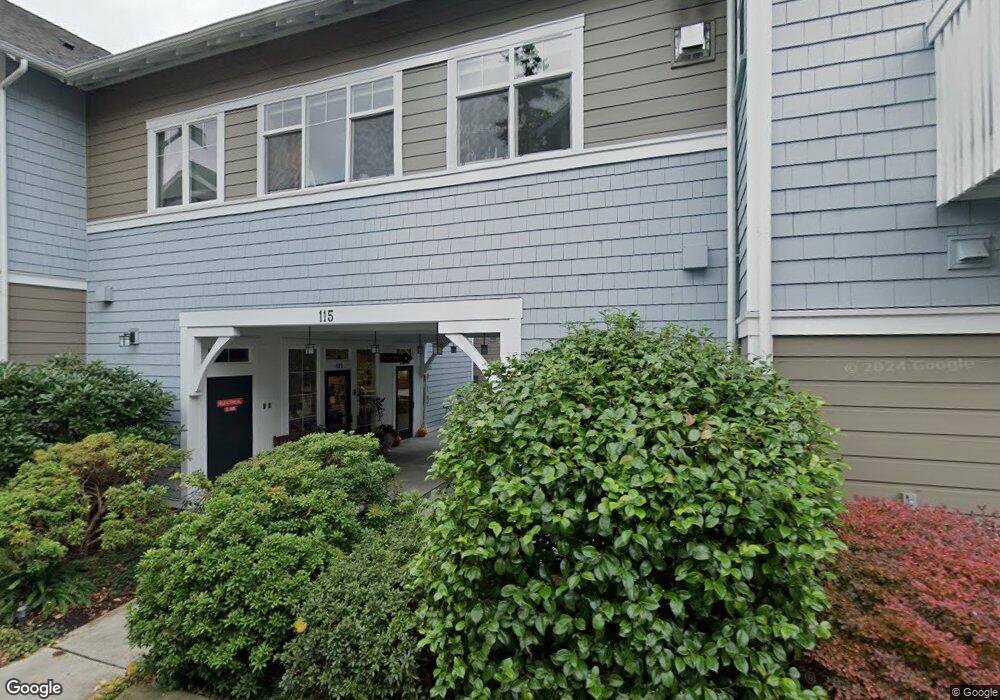
115 Hall Brothrs Loop Unit 208 Bainbridge Island, WA 98110
Estimated Value: $581,503 - $772,000
3
Beds
2
Baths
1,170
Sq Ft
$576/Sq Ft
Est. Value
About This Home
This home is located at 115 Hall Brothrs Loop Unit 208, Bainbridge Island, WA 98110 and is currently estimated at $674,376, approximately $576 per square foot. 115 Hall Brothrs Loop Unit 208 is a home located in Kitsap County with nearby schools including Bainbridge High School, Madrona School, and St. Cecilia Catholic School.
Ownership History
Date
Name
Owned For
Owner Type
Purchase Details
Closed on
Jan 4, 2023
Sold by
Strachan-Olson Family Trust
Bought by
Olson Christopher A and Strachan-Olson Wendy R
Current Estimated Value
Purchase Details
Closed on
Sep 4, 2015
Sold by
Roemer Ronald J
Bought by
The Strachan Olson Family Trust
Home Financials for this Owner
Home Financials are based on the most recent Mortgage that was taken out on this home.
Original Mortgage
$330,650
Interest Rate
3.91%
Mortgage Type
New Conventional
Purchase Details
Closed on
Jul 12, 2007
Sold by
Alliance Mixed Use Llc
Bought by
Roemer Ronald J and Roemer Maria T
Home Financials for this Owner
Home Financials are based on the most recent Mortgage that was taken out on this home.
Original Mortgage
$324,000
Interest Rate
5.87%
Mortgage Type
Unknown
Create a Home Valuation Report for This Property
The Home Valuation Report is an in-depth analysis detailing your home's value as well as a comparison with similar homes in the area
Home Values in the Area
Average Home Value in this Area
Purchase History
| Date | Buyer | Sale Price | Title Company |
|---|---|---|---|
| Olson Christopher A | -- | First American Title | |
| The Strachan Olson Family Trust | $389,000 | Pacific Nw Title | |
| Roemer Ronald J | $405,280 | Pacific Nw Title |
Source: Public Records
Mortgage History
| Date | Status | Borrower | Loan Amount |
|---|---|---|---|
| Previous Owner | The Strachan Olson Family Trust | $330,650 | |
| Previous Owner | Roemer Ronald J | $324,000 |
Source: Public Records
Tax History Compared to Growth
Tax History
| Year | Tax Paid | Tax Assessment Tax Assessment Total Assessment is a certain percentage of the fair market value that is determined by local assessors to be the total taxable value of land and additions on the property. | Land | Improvement |
|---|---|---|---|---|
| 2026 | $4,394 | $526,630 | -- | $526,630 |
| 2025 | $4,394 | $526,630 | -- | $526,630 |
| 2024 | $4,012 | $477,670 | -- | $477,670 |
| 2023 | $3,988 | $477,670 | $0 | $477,670 |
| 2022 | $4,623 | $477,670 | $0 | $477,670 |
| 2021 | $4,611 | $454,920 | $0 | $454,920 |
| 2020 | $4,672 | $454,920 | $0 | $454,920 |
| 2019 | $4,006 | $395,580 | $0 | $395,580 |
| 2018 | $4,257 | $327,600 | $0 | $327,600 |
| 2017 | $3,501 | $327,600 | $0 | $327,600 |
| 2016 | $2,901 | $256,550 | $0 | $256,550 |
| 2015 | $2,599 | $233,230 | $0 | $233,230 |
| 2014 | -- | $233,230 | $0 | $233,230 |
| 2013 | -- | $245,510 | $0 | $245,510 |
Source: Public Records
Map
Nearby Homes
- 144 Hall Brothers Loop NW Unit 101
- 259 Shepard Way NW Unit 204
- 214 Shepard Way NW
- 204 Shepard Way NW
- 200 Shepard Way NW
- 230 Canopy Path NW
- 224 Canopy Path NW
- 392 Wills Ln NW
- 141 Parfitt Way SW Unit A-35
- 141 Parfitt Way SW Unit M-10
- 522 Madrona Way NE Unit 4
- 465 Winslow Way E Unit 108
- 774 Madison Ave N Unit B774
- 171 Wallace Way NE Unit B
- 752 NE Vineyard Ln Unit L205
- 620 NE Vineyard Ln Unit B302
- 610 NE Vineyard Ln Unit A104
- 9986 NE Ewing St
- 1240 Weaver Rd NW Unit B1
- 300 High School Rd NE Unit 203
- 115 Hall Brothers Loop Unit 205
- 115 Hall Brothers Loop Unit 4
- 115 Hall Brothers Loop NW Unit 201
- 115 Hall Brothers Loop NW Unit 2
- 115 Hall Brothers Loop
- 115 Hall Brothers Loop NW Unit 205
- 115 Hall Brothers Loop NW Unit 7
- 115 Hall Brothers Loop NW Unit 206
- 115 Hall Brothers Loop NW Unit 207
- 115 Hall Brothers Loop NW Unit 5
- 115 Hall Brothers Loop NW Unit 4
- 115 Hall Brothers Loop Unit 9
- 115 Hall Brothrs Loop Unit 207
- 115 Hall Brothrs Loop Unit 201
- 115 Hall Brothrs Loop Unit 205
- 115 Hall Brothrs Loop Unit 206
- 115 Hall Brothers Loop NW Unit 204
- 115 Hall Brothers Loop Unit 201
- 115 Hall Brothers Loop Unit 204
- 115 Hall Brothers Lp NE Unit 208