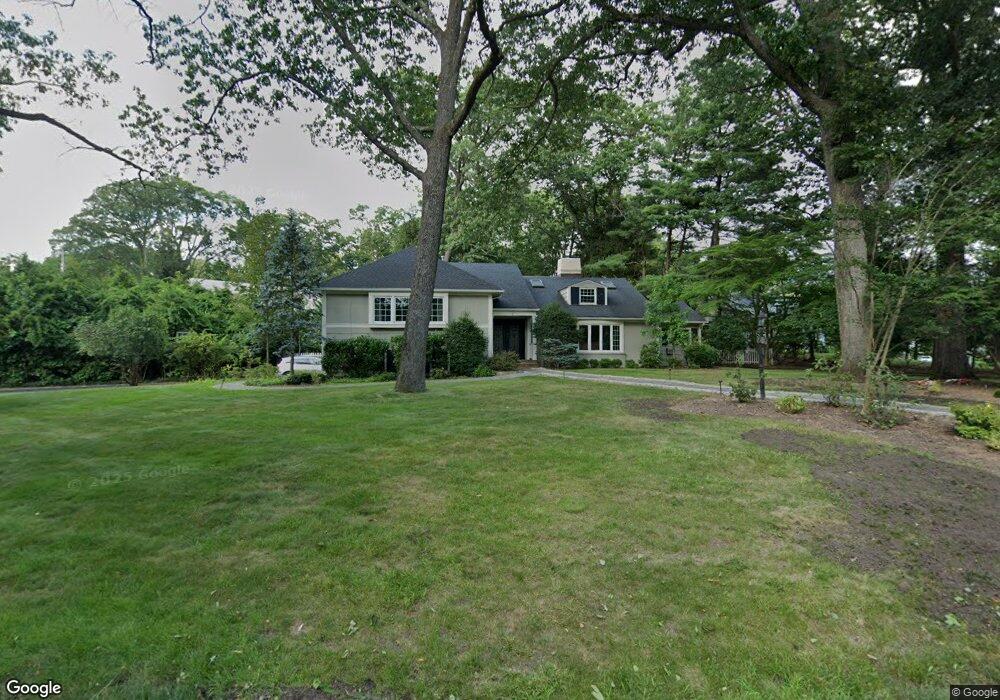
115 Heller Way Montclair, NJ 07043
Estimated Value: $1,953,304 - $2,249,000
--
Bed
--
Bath
3,787
Sq Ft
$541/Sq Ft
Est. Value
About This Home
This home is located at 115 Heller Way, Montclair, NJ 07043 and is currently estimated at $2,047,326, approximately $540 per square foot. 115 Heller Way is a home located in Essex County with nearby schools including Bradford School, Hillside School, and Northeast Elementary School.
Ownership History
Date
Name
Owned For
Owner Type
Purchase Details
Closed on
Jul 16, 2008
Sold by
Farlie William N and Farlie Barbara L
Bought by
Israni Sanjay and Israni Priya
Current Estimated Value
Home Financials for this Owner
Home Financials are based on the most recent Mortgage that was taken out on this home.
Original Mortgage
$417,000
Interest Rate
6.06%
Mortgage Type
Purchase Money Mortgage
Purchase Details
Closed on
May 13, 1999
Sold by
Dunlap Donna
Bought by
Farlie William and Farlie Barbara
Purchase Details
Closed on
Oct 23, 1998
Sold by
Blanks Martin
Bought by
Dunlap Donna
Purchase Details
Closed on
Nov 22, 1995
Sold by
Turrell Michael
Bought by
Blanks Martin and Blanks Donna
Home Financials for this Owner
Home Financials are based on the most recent Mortgage that was taken out on this home.
Original Mortgage
$328,000
Interest Rate
7.91%
Purchase Details
Closed on
Oct 8, 1991
Sold by
Dverden Thomas and Dverden Anne
Bought by
Turrell Michael and Turrell Josephine
Create a Home Valuation Report for This Property
The Home Valuation Report is an in-depth analysis detailing your home's value as well as a comparison with similar homes in the area
Home Values in the Area
Average Home Value in this Area
Purchase History
| Date | Buyer | Sale Price | Title Company |
|---|---|---|---|
| Israni Sanjay | $950,000 | Fee Simple Title Llc | |
| Farlie William | $556,500 | -- | |
| Dunlap Donna | $26,127 | -- | |
| Blanks Martin | $430,000 | -- | |
| Turrell Michael | $580,000 | -- |
Source: Public Records
Mortgage History
| Date | Status | Borrower | Loan Amount |
|---|---|---|---|
| Closed | Israni Sanjay | $417,000 | |
| Previous Owner | Blanks Martin | $328,000 |
Source: Public Records
Tax History Compared to Growth
Tax History
| Year | Tax Paid | Tax Assessment Tax Assessment Total Assessment is a certain percentage of the fair market value that is determined by local assessors to be the total taxable value of land and additions on the property. | Land | Improvement |
|---|---|---|---|---|
| 2025 | $31,265 | $925,000 | $455,400 | $469,600 |
| 2024 | $31,265 | $925,000 | $455,400 | $469,600 |
| 2022 | $30,414 | $925,000 | $455,400 | $469,600 |
| 2021 | $29,887 | $925,000 | $455,400 | $469,600 |
| 2020 | $29,406 | $925,000 | $455,400 | $469,600 |
| 2019 | $29,101 | $925,000 | $455,400 | $469,600 |
| 2018 | $28,620 | $925,000 | $455,400 | $469,600 |
| 2017 | $31,164 | $834,600 | $405,300 | $429,300 |
| 2016 | $30,329 | $834,600 | $405,300 | $429,300 |
| 2015 | $29,428 | $834,600 | $405,300 | $429,300 |
| 2014 | $28,443 | $834,600 | $405,300 | $429,300 |
Source: Public Records
Map
Nearby Homes
- 107 Heller Way
- 123 Heller Way
- 112 Heller Way
- 116 Heller Way
- 106 Heller Way
- 99 Heller Way
- 122 Heller Way
- 126 Heller Way
- 127 Heller Way
- 27 Heller Dr
- 82 Yantacaw Brook Rd
- 84 Yantacaw Brook Rd
- 95 Heller Way
- 86 Yantacaw Brook Rd
- 23 Heller Dr
- 76 Yantacaw Brook Rd
- 88 Yantacaw Brook Rd
- 130 Heller Way
- 90 Yantacaw Brook Rd
- 9 Heller Dr