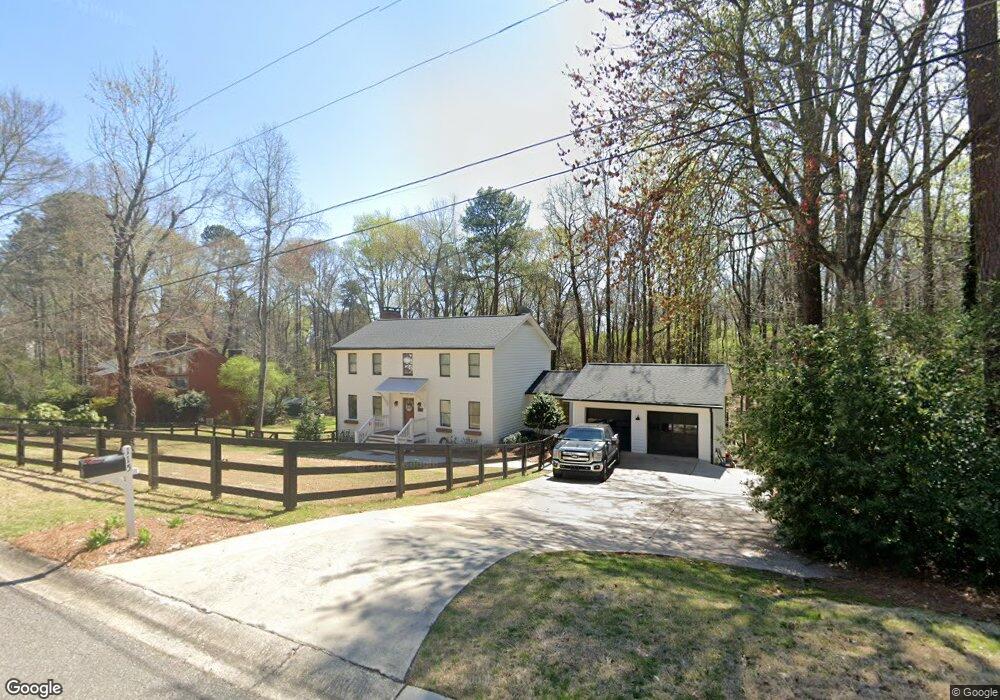
115 Hickory Knoll Unit 60 Cumming, GA 30040
Estimated Value: $581,000 - $630,486
4
Beds
4
Baths
2,269
Sq Ft
$267/Sq Ft
Est. Value
About This Home
This home is located at 115 Hickory Knoll Unit 60, Cumming, GA 30040 and is currently estimated at $606,622, approximately $267 per square foot. 115 Hickory Knoll Unit 60 is a home located in Forsyth County with nearby schools including Cumming Elementary School, Otwell Middle School, and Forsyth Central High School.
Ownership History
Date
Name
Owned For
Owner Type
Purchase Details
Closed on
Aug 25, 2023
Sold by
Balkcom Virginia
Bought by
Balkcom Virginia and Carter Jordan Lee
Current Estimated Value
Home Financials for this Owner
Home Financials are based on the most recent Mortgage that was taken out on this home.
Original Mortgage
$492,000
Outstanding Balance
$481,098
Interest Rate
6.96%
Mortgage Type
New Conventional
Estimated Equity
$125,524
Purchase Details
Closed on
Jul 24, 2015
Sold by
Kmj Real Estate Investments Inc
Bought by
Cox James J and Cox Deanne E
Home Financials for this Owner
Home Financials are based on the most recent Mortgage that was taken out on this home.
Original Mortgage
$260,396
Interest Rate
3.75%
Mortgage Type
FHA
Purchase Details
Closed on
Jan 28, 2015
Sold by
Sleppy Janet E
Bought by
Kmj Real Estate Investments In
Create a Home Valuation Report for This Property
The Home Valuation Report is an in-depth analysis detailing your home's value as well as a comparison with similar homes in the area
Home Values in the Area
Average Home Value in this Area
Purchase History
| Date | Buyer | Sale Price | Title Company |
|---|---|---|---|
| Balkcom Virginia | -- | None Listed On Document | |
| Balkcom Virginia | $615,000 | None Listed On Document | |
| Cox James J | $265,200 | -- | |
| Kmj Real Estate Investments In | $135,000 | -- | |
| Sleppy Janet E | -- | -- |
Source: Public Records
Mortgage History
| Date | Status | Borrower | Loan Amount |
|---|---|---|---|
| Open | Balkcom Virginia | $492,000 | |
| Previous Owner | Cox James J | $260,396 |
Source: Public Records
Tax History Compared to Growth
Tax History
| Year | Tax Paid | Tax Assessment Tax Assessment Total Assessment is a certain percentage of the fair market value that is determined by local assessors to be the total taxable value of land and additions on the property. | Land | Improvement |
|---|---|---|---|---|
| 2025 | $5,751 | $242,576 | $49,932 | $192,644 |
| 2024 | $5,751 | $234,532 | $47,160 | $187,372 |
| 2023 | $3,168 | $178,312 | $33,288 | $145,024 |
| 2022 | $3,311 | $131,480 | $28,000 | $103,480 |
| 2021 | $3,132 | $131,480 | $28,000 | $103,480 |
| 2020 | $3,016 | $125,828 | $28,000 | $97,828 |
| 2019 | $2,958 | $122,780 | $18,000 | $104,780 |
| 2018 | $2,834 | $115,968 | $18,000 | $97,968 |
| 2017 | $2,624 | $105,480 | $18,000 | $87,480 |
| 2016 | $2,624 | $105,480 | $18,000 | $87,480 |
| 2015 | $418 | $72,900 | $18,000 | $54,900 |
| 2014 | $371 | $55,992 | $0 | $0 |
Source: Public Records
Map
Nearby Homes
- 310 Samaritan Dr
- 505 Samaritan Dr
- 304 Oakfield Ln
- 110 Mountain View Dr
- 517 Kelly Mill Rd
- 516 Kelly Mill Rd Unit LAND
- 516 Kelly Mill Rd Unit HOME
- 516 Kelly Mill Rd
- 4945 Bay Dr
- 825 Mill Garden Place
- 460 Tribble Gap Rd Unit 102
- 460 Tribble Gap Rd Unit 604
- 213 Pine Crest Dr
- 481 Sawnee Corners Dr
- 116 E Maple St
- 4010 Village Estates Ct
- 113 Hickory Trail
- 3460 Trow Creek Ln
- 3995 Village Estates Ct
- 208 Pirkle Ferry Rd
- 115 Hickory Knoll
- 115 Hickory Knolls
- 113 Hickory Knolls
- 117 Hickory Knolls
- 118 Hickory Knolls
- 120 Hickory Knolls
- 118 Hickory Knoll
- 111 Hickory Knolls
- 114 Hickory Knolls
- 122 Hickory Knolls
- 122 Hickory Knolls
- 119 Hickory Knolls
- 311 Samaritan Dr
- 109 Hickory Knolls
- 309 Samaritan Dr
- 112 Hickory Knolls
- 401 Samaritan Dr
- 315 Samaritan Dr
- 0 Hickory Knolls Unit 3289192
- 307 Samaritan Dr