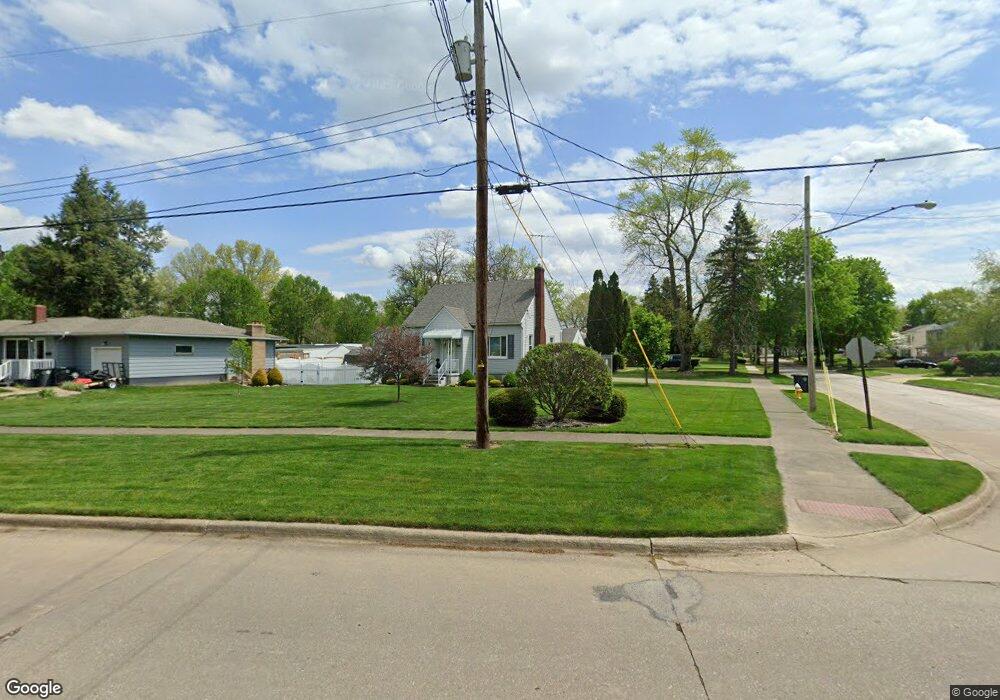
115 High Grove Blvd Akron, OH 44312
Ellet NeighborhoodEstimated Value: $138,000 - $163,000
3
Beds
1
Bath
680
Sq Ft
$219/Sq Ft
Est. Value
About This Home
This home is located at 115 High Grove Blvd, Akron, OH 44312 and is currently estimated at $148,958, approximately $219 per square foot. 115 High Grove Blvd is a home located in Summit County with nearby schools including Ellet High School, Summit Academy Akron Elementary School, and Hatton Community Learning Center.
Ownership History
Date
Name
Owned For
Owner Type
Purchase Details
Closed on
Apr 25, 2016
Sold by
Carson Karen
Bought by
Carson Thomas A
Current Estimated Value
Purchase Details
Closed on
Apr 21, 2016
Sold by
Zonker Paul L
Bought by
Carson Karen R
Purchase Details
Closed on
Jun 27, 2006
Sold by
Zonker Paul L and Zonker Debbie
Bought by
Carson Karen and Zonker Ronald A
Purchase Details
Closed on
May 23, 2005
Sold by
Zonker Ronald A and Carson Karen R Zonker
Bought by
Zonker Charles W and Carson Karen R
Purchase Details
Closed on
Jul 31, 2004
Sold by
Zonker Charles W
Bought by
Zonker Charles W and Charles W & Betty J Zonker Revocable Liv
Purchase Details
Closed on
Mar 26, 2003
Sold by
Zonker Charles W & Betty J Trustees
Bought by
Zonker Charles W and Zonker Betty J
Purchase Details
Closed on
Apr 11, 2000
Sold by
Zonker Charles W and Zonker Betty J
Bought by
Zonker Charles W and Zonker Betty J
Create a Home Valuation Report for This Property
The Home Valuation Report is an in-depth analysis detailing your home's value as well as a comparison with similar homes in the area
Home Values in the Area
Average Home Value in this Area
Purchase History
| Date | Buyer | Sale Price | Title Company |
|---|---|---|---|
| Carson Thomas A | -- | None Available | |
| Carson Karen R | -- | None Available | |
| Carson Karen | $33,134 | First American Title Ins Co | |
| Zonker Charles W | -- | -- | |
| Zonker Charles W | -- | -- | |
| Zonker Charles W | -- | -- | |
| Zonker Charles W | -- | -- |
Source: Public Records
Tax History Compared to Growth
Tax History
| Year | Tax Paid | Tax Assessment Tax Assessment Total Assessment is a certain percentage of the fair market value that is determined by local assessors to be the total taxable value of land and additions on the property. | Land | Improvement |
|---|---|---|---|---|
| 2025 | $1,914 | $41,209 | $9,240 | $31,969 |
| 2024 | $1,914 | $41,209 | $9,240 | $31,969 |
| 2023 | $1,914 | $41,209 | $9,240 | $31,969 |
| 2022 | $1,818 | $32,449 | $7,277 | $25,172 |
| 2021 | $1,819 | $32,449 | $7,277 | $25,172 |
| 2020 | $1,795 | $32,450 | $7,280 | $25,170 |
| 2019 | $1,509 | $26,220 | $9,850 | $16,370 |
| 2018 | $1,492 | $26,220 | $9,850 | $16,370 |
| 2017 | $1,512 | $26,220 | $9,850 | $16,370 |
| 2016 | $1,513 | $26,220 | $9,850 | $16,370 |
| 2015 | $1,512 | $26,220 | $9,850 | $16,370 |
| 2014 | $1,501 | $26,220 | $9,850 | $16,370 |
| 2013 | $1,534 | $27,070 | $9,850 | $17,220 |
Source: Public Records
Map
Nearby Homes
- 2863 Burnside St
- 256 High Grove Blvd
- 179 Davenport Ave
- 6 Kreiner Ave
- 5 Kreiner Ave
- 47 Kreiner Ave
- 117 Kreiner Ave
- 412 Stevenson Ave
- 423 Stetler Ave
- 307 Pauline Ave
- 0 Kreiner Ave
- 440 Wirth Ave
- 2948 Trenton Rd
- 218 Canton Rd
- 490 Stevenson Ave
- 379 Stull Ave
- 2528 Ogden Ave
- 544 Dennison Ave
- 2514 Primewood Rd
- 48 Marion Ave
- 105 High Grove Blvd
- 2823 Burnside St
- 2818 Robindale Ave
- 2818 Robindale Ave
- 131 High Grove Blvd
- 2824 Robindale Ave
- 99 High Grove Blvd
- 2833 Burnside St
- 2830 Burnside St
- 128 High Grove Blvd
- 120 High Grove Blvd
- 139 High Grove Blvd
- 134 High Grove Blvd
- 2834 Robindale Ave
- 114 High Grove Blvd
- 2834 Burnside St
- 110 High Grove Blvd
- 140 High Grove Blvd
- 2839 Burnside St
- 2840 Burnside St