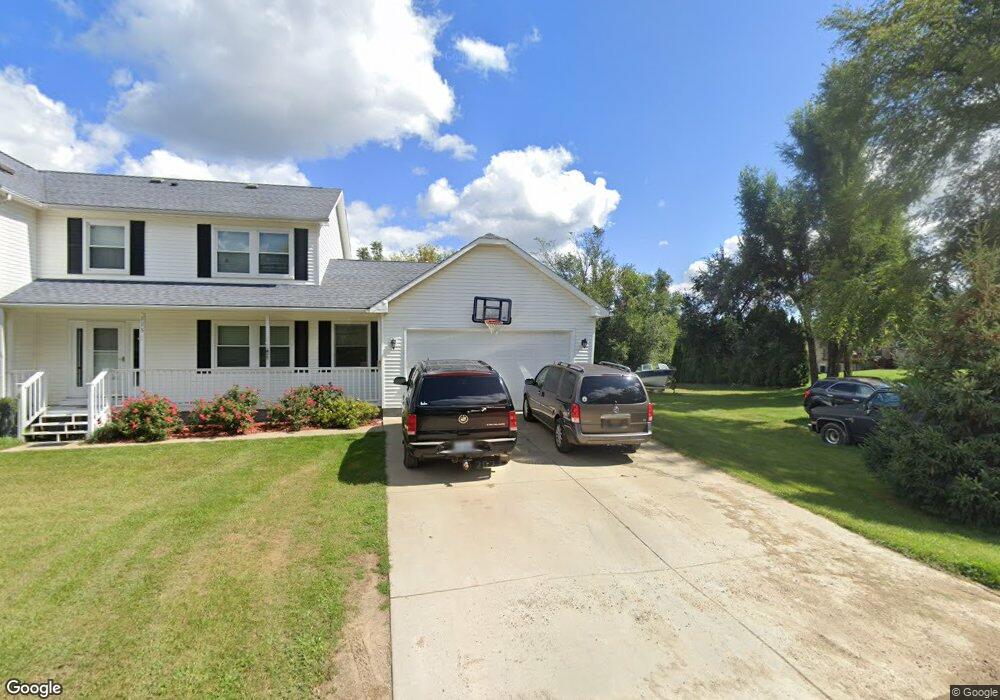
115 Ivanhoe Dr Unit IVANHOE Brooklyn, MI 49230
Estimated Value: $360,000 - $418,000
4
Beds
3
Baths
2,405
Sq Ft
$162/Sq Ft
Est. Value
About This Home
This home is located at 115 Ivanhoe Dr Unit IVANHOE, Brooklyn, MI 49230 and is currently estimated at $388,667, approximately $161 per square foot. 115 Ivanhoe Dr Unit IVANHOE is a home located in Jackson County with nearby schools including Columbia Lower Elementary School, Columbia Upper Elementary School, and Columbia Central Jr./Sr. High School.
Ownership History
Date
Name
Owned For
Owner Type
Purchase Details
Closed on
Aug 22, 2018
Sold by
Sokoll Mark
Bought by
Sokoll Michael T
Current Estimated Value
Home Financials for this Owner
Home Financials are based on the most recent Mortgage that was taken out on this home.
Original Mortgage
$178,709
Outstanding Balance
$155,202
Interest Rate
4.5%
Mortgage Type
VA
Estimated Equity
$233,465
Purchase Details
Closed on
Apr 13, 2017
Sold by
Sokoll Mark and Sokoll Julie
Bought by
Sokoll Mark
Purchase Details
Closed on
Oct 11, 2010
Sold by
United Mortgage Company
Bought by
Federal National Mortgage Association
Purchase Details
Closed on
Apr 3, 1997
Sold by
Sullivan Sean P and Sullivan Faith A
Bought by
Clemons Benjamin J and Clemons Linda
Purchase Details
Closed on
Jan 11, 1996
Sold by
Gorman Charles A
Bought by
Sullivan Sean P and Sullivan Faith A
Create a Home Valuation Report for This Property
The Home Valuation Report is an in-depth analysis detailing your home's value as well as a comparison with similar homes in the area
Purchase History
| Date | Buyer | Sale Price | Title Company |
|---|---|---|---|
| Sokoll Michael T | $173,000 | None Available | |
| Sokoll Mark | -- | Attorney | |
| Federal National Mortgage Association | -- | None Available | |
| Clemons Benjamin J | $7,500 | -- | |
| Sullivan Sean P | $5,800 | -- |
Source: Public Records
Mortgage History
| Date | Status | Borrower | Loan Amount |
|---|---|---|---|
| Open | Sokoll Michael T | $178,709 |
Source: Public Records
Tax History
| Year | Tax Paid | Tax Assessment Tax Assessment Total Assessment is a certain percentage of the fair market value that is determined by local assessors to be the total taxable value of land and additions on the property. | Land | Improvement |
|---|---|---|---|---|
| 2025 | $4,660 | $157,600 | $0 | $0 |
| 2024 | $29 | $149,000 | $0 | $0 |
| 2023 | $1,659 | $136,800 | $0 | $0 |
| 2022 | $2,413 | $118,100 | $0 | $0 |
| 2021 | $2,382 | $112,800 | $0 | $0 |
| 2020 | $2,356 | $113,400 | $0 | $0 |
| 2019 | $2,298 | $95,600 | $0 | $0 |
| 2018 | $3,636 | $88,500 | $0 | $0 |
| 2017 | $4,025 | $86,200 | $0 | $0 |
| 2016 | $2,780 | $85,300 | $85,300 | $0 |
| 2015 | $3,933 | $78,900 | $78,900 | $0 |
| 2014 | $3,933 | $74,600 | $0 | $0 |
| 2013 | -- | $74,600 | $74,600 | $0 |
Source: Public Records
Map
Nearby Homes
- 207 Ambler Dr
- VL Kirkley Dr
- 200 Barbara Dr
- 224 Ambler Dr
- 133 Bingham Dr
- 227 Riviera Dr
- VL Carlysle Dr
- 119 Nottingham Dr
- 0 Lot 44 & 45 Wilkshire Dr Unit 25044305
- 000 Hewitt Rd
- 6416 Kelley Rd
- 6770 Cement City Rd
- 167 Golfview Dr
- 154 Golfview Dr
- 215 Somerset Dr
- 261 Somerset Dr
- 12695 Dearmyer Rd
- 2217 Shady Ln
- 146 Ashley Ct
- 144 Ashley Ct
- 115 Ivanhoe Dr
- 0 Ivanhoe Dr Unit 20001705
- 114 Ivanhoe Dr
- 240 Barbara Dr
- 241 Kirkley Dr
- 116 Ivanhoe Dr
- 112 Ivanhoe Dr
- 112 Ivanhoe Dr
- 238 Barbara Dr
- 118 Ivanhoe Dr
- 242 Kirkley Dr
- 236 Barbara Dr
- 124 Ivanhoe Dr
- 106 Ivanhoe Dr
- 235 Kirkley Dr
- 238 Kirkley Dr
- 239 Barbara Dr
- 318 Nottingham Dr
- 234 Barbara Dr
- 310 Nottingham Dr
Your Personal Tour Guide
Ask me questions while you tour the home.