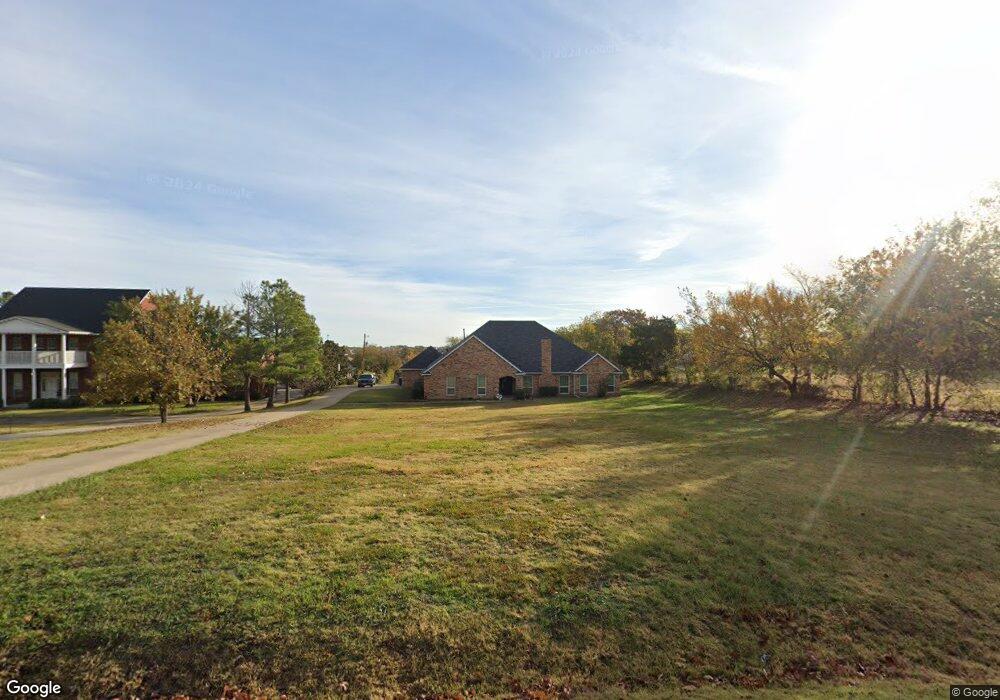
115 Jellico Cir Southlake, TX 76092
Estimated Value: $901,000 - $1,380,000
4
Beds
3
Baths
3,554
Sq Ft
$342/Sq Ft
Est. Value
About This Home
This home is located at 115 Jellico Cir, Southlake, TX 76092 and is currently estimated at $1,214,983, approximately $341 per square foot. 115 Jellico Cir is a home located in Tarrant County with nearby schools including Florence Elementary School, Bear Creek Intermediate School, and Keller Middle School.
Ownership History
Date
Name
Owned For
Owner Type
Purchase Details
Closed on
Feb 8, 2019
Sold by
Oleary Patrick M
Bought by
Quinones Michael C
Current Estimated Value
Home Financials for this Owner
Home Financials are based on the most recent Mortgage that was taken out on this home.
Original Mortgage
$440,000
Outstanding Balance
$386,050
Interest Rate
4.4%
Mortgage Type
Purchase Money Mortgage
Estimated Equity
$828,933
Purchase Details
Closed on
Sep 25, 2000
Sold by
Cooper Richard F
Bought by
Oleary Patrick M
Home Financials for this Owner
Home Financials are based on the most recent Mortgage that was taken out on this home.
Original Mortgage
$252,700
Interest Rate
7.99%
Purchase Details
Closed on
Oct 29, 1999
Sold by
Cooper Linda Teresa
Bought by
Cooper Richard F
Create a Home Valuation Report for This Property
The Home Valuation Report is an in-depth analysis detailing your home's value as well as a comparison with similar homes in the area
Home Values in the Area
Average Home Value in this Area
Purchase History
| Date | Buyer | Sale Price | Title Company |
|---|---|---|---|
| Quinones Michael C | -- | Fidelity National Title | |
| Oleary Patrick M | -- | Safeco Land Title | |
| Cooper Richard F | -- | -- | |
| Cooper Richard F | -- | -- |
Source: Public Records
Mortgage History
| Date | Status | Borrower | Loan Amount |
|---|---|---|---|
| Open | Quinones Michael C | $440,000 | |
| Previous Owner | Oleary Patrick M | $252,700 | |
| Closed | Oleary Patrick M | $35,300 |
Source: Public Records
Tax History Compared to Growth
Tax History
| Year | Tax Paid | Tax Assessment Tax Assessment Total Assessment is a certain percentage of the fair market value that is determined by local assessors to be the total taxable value of land and additions on the property. | Land | Improvement |
|---|---|---|---|---|
| 2025 | $9,597 | $889,000 | $575,000 | $314,000 |
| 2024 | $9,597 | $913,000 | $575,000 | $338,000 |
| 2023 | $11,541 | $991,529 | $575,000 | $416,529 |
| 2022 | $12,163 | $890,558 | $450,000 | $440,558 |
| 2021 | $11,942 | $500,000 | $450,000 | $50,000 |
| 2020 | $12,035 | $500,000 | $450,000 | $50,000 |
| 2019 | $12,758 | $500,000 | $450,000 | $50,000 |
| 2018 | $20,919 | $819,868 | $230,000 | $589,868 |
| 2017 | $17,845 | $684,067 | $230,000 | $454,067 |
| 2016 | $17,175 | $658,409 | $400,000 | $258,409 |
| 2015 | $10,872 | $411,300 | $150,000 | $261,300 |
| 2014 | $10,872 | $411,300 | $150,000 | $261,300 |
Source: Public Records
Map
Nearby Homes
- 127 Jellico Cir
- 2608 W Southlake Blvd
- 2740 W Southlake Blvd
- 112 Stony Brook Way
- 146 Jellico Cir
- 2655 Johnson Rd
- 275 Timberline Ln
- 2525 Park Grove Loop
- 351 Watermere Dr
- 3095 Johnson Rd
- 2636 Park Grove Loop
- 365 Watermere Dr
- 2620 Park Grove Loop
- 2616 Park Grove Loop
- 2401 Lower Brook Ct
- 301 Watermere Dr Unit 401
- 301 Watermere Dr Unit 317
- 301 Watermere Dr Unit 216
- 605 Royal Ln
- 404 Branding Iron Ct
- 119 Jellico Cir
- 111 Jellico Cir
- 118 Jellico Cir
- 114 Jellico Cir
- 122 Jellico Cir
- 2608 W Southlake (1709) Blvd
- 110 Jellico Cir
- 126 Jellico Cir
- 106 Jellico Cir
- 130 Jellico Cir
- 135 Jellico Cir
- 163 Jellico Cir
- 167 Jellico Cir
- 134 Jellico Cir
- 109 River Oaks Dr
- 171 Jellico Cir
- 155 Jellico Cir W
- 155 Jellico Cir
- 137 Jellico Cir
- 180 Jellico Cir