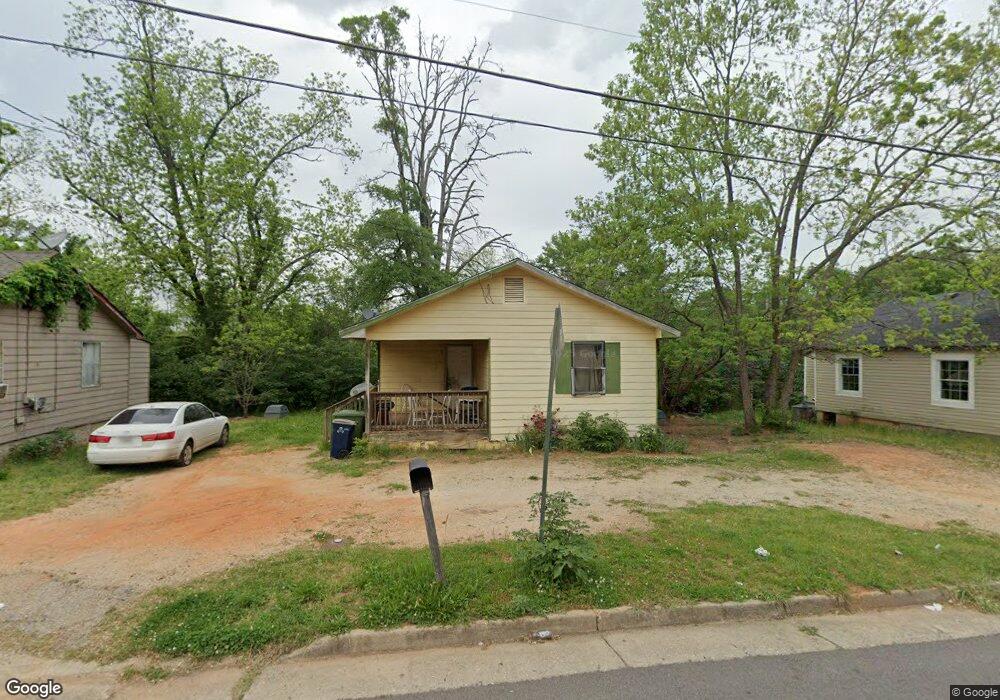
115 Kentucky Ave Griffin, GA 30223
Spalding County NeighborhoodEstimated Value: $68,000 - $111,000
2
Beds
1
Bath
984
Sq Ft
$94/Sq Ft
Est. Value
About This Home
This home is located at 115 Kentucky Ave, Griffin, GA 30223 and is currently estimated at $92,579, approximately $94 per square foot. 115 Kentucky Ave is a home located in Spalding County with nearby schools including Moore Elementary School, Kennedy Road Middle School, and Spalding High School.
Ownership History
Date
Name
Owned For
Owner Type
Purchase Details
Closed on
May 31, 2017
Bought by
Gibson Mark
Current Estimated Value
Purchase Details
Closed on
Jan 21, 2016
Sold by
Buck Tyler P
Bought by
Peachey Properties Llc
Purchase Details
Closed on
Apr 22, 2015
Sold by
Georgia Residential Partners Llc
Bought by
Buck Tyler
Home Financials for this Owner
Home Financials are based on the most recent Mortgage that was taken out on this home.
Original Mortgage
$12,875
Interest Rate
3.79%
Mortgage Type
New Conventional
Purchase Details
Closed on
Dec 18, 2014
Sold by
Griffen Quads Llc
Bought by
Georgia Residential Partners L
Purchase Details
Closed on
Dec 31, 2013
Sold by
Bush Neal A
Bought by
Griffen Quads Llc
Purchase Details
Closed on
Apr 3, 1986
Sold by
Fortune James R Etal
Bought by
Bush Neal A
Purchase Details
Closed on
Jan 4, 1982
Sold by
Adams Frances White
Bought by
Fortune James R Jr Etal
Purchase Details
Closed on
Jan 1, 1967
Sold by
White Miss Frances R
Bought by
Adams Frances White
Purchase Details
Closed on
Jun 3, 1943
Bought by
White Miss Frances R
Create a Home Valuation Report for This Property
The Home Valuation Report is an in-depth analysis detailing your home's value as well as a comparison with similar homes in the area
Home Values in the Area
Average Home Value in this Area
Purchase History
| Date | Buyer | Sale Price | Title Company |
|---|---|---|---|
| Gibson Mark | $53,900 | -- | |
| Peachey Properties Llc | -- | -- | |
| Buck Tyler | $25,000 | -- | |
| Georgia Residential Partners L | $300,000 | -- | |
| Griffen Quads Llc | $309,250 | -- | |
| Bush Neal A | $5,000 | -- | |
| Fortune James R Jr Etal | $58,000 | -- | |
| Adams Frances White | -- | -- | |
| White Miss Frances R | -- | -- |
Source: Public Records
Mortgage History
| Date | Status | Borrower | Loan Amount |
|---|---|---|---|
| Previous Owner | Buck Tyler | $12,875 |
Source: Public Records
Tax History Compared to Growth
Tax History
| Year | Tax Paid | Tax Assessment Tax Assessment Total Assessment is a certain percentage of the fair market value that is determined by local assessors to be the total taxable value of land and additions on the property. | Land | Improvement |
|---|---|---|---|---|
| 2024 | $774 | $20,056 | $4,000 | $16,056 |
| 2023 | $892 | $22,332 | $3,600 | $18,732 |
| 2022 | $738 | $18,466 | $2,000 | $16,466 |
| 2021 | $636 | $15,906 | $1,900 | $14,006 |
| 2020 | $636 | $15,906 | $1,900 | $14,006 |
| 2019 | $647 | $15,906 | $1,900 | $14,006 |
| 2018 | $337 | $14,514 | $1,900 | $12,614 |
| 2017 | $600 | $14,514 | $1,900 | $12,614 |
| 2016 | $420 | $14,514 | $1,900 | $12,614 |
| 2015 | $658 | $15,414 | $1,900 | $13,514 |
| 2014 | -- | $15,414 | $1,900 | $13,514 |
Source: Public Records
Map
Nearby Homes
- 209 Kentucky Ave
- 202 Lexington Ave Unit A & B
- 818 Haskell Ward Dr
- 221 Lexington Ave
- 101 Behan Place
- 112 W Lexington Ave
- 117 Thurman St
- 122 W Lexington Ave
- 125 W Lexington Ave
- 135 Alabama St
- 554 N 8th St
- 602 Circus St
- 546 N 8th St
- 607 Lane St
- 102 E Cherry St
- 106 E Cherry St
- 606 N 9th St
- 346 Adams St
- 588 Elles Way
- N 9 St
- 111 Kentucky Ave
- 825 Stark St
- 117 Kentucky Ave
- 827 Stark St
- 105 Kentucky Ave
- 0 Kentucky Ave
- 0 Stark St Unit 7505616
- 116 Lexington Ave
- 106 Lexington Ave
- 820 Stark St
- 201 Kentucky Ave
- 117 Lexington Ave
- 101 Kentucky Ave
- 102 Lexington Ave
- 202 Lexington Ave
- 202 Kentucky Ave
- 204 Lexington Ave
- 102 Kentucky Ave
- 836 N Hill St
- 846 N Hill St