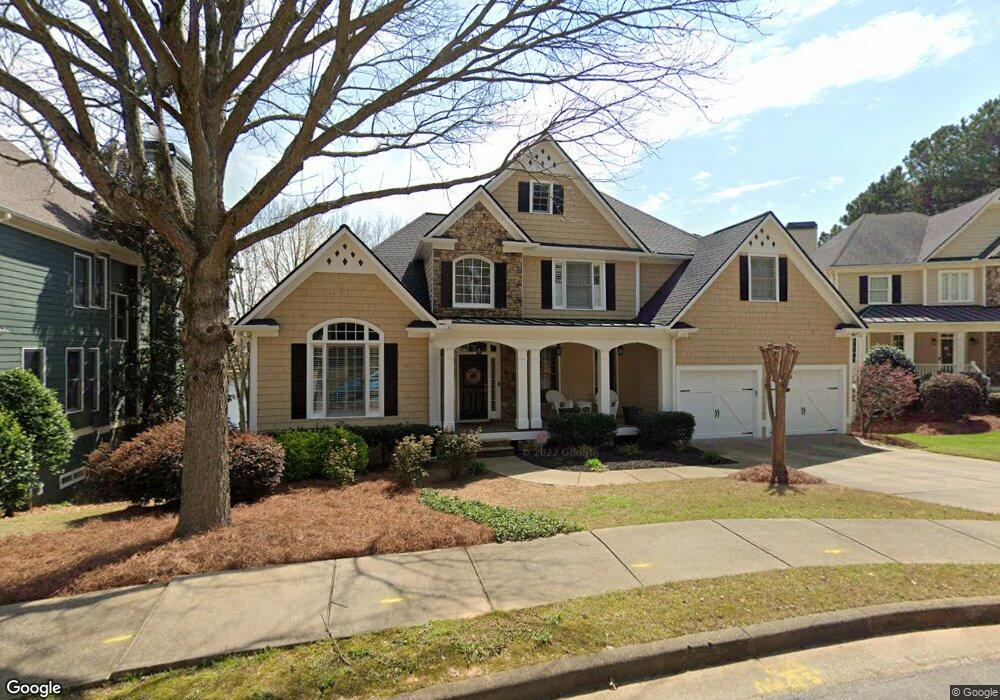
115 Lake Windward Landing Alpharetta, GA 30005
Windward NeighborhoodEstimated Value: $960,000 - $1,342,000
5
Beds
5
Baths
3,385
Sq Ft
$337/Sq Ft
Est. Value
About This Home
This home is located at 115 Lake Windward Landing, Alpharetta, GA 30005 and is currently estimated at $1,141,797, approximately $337 per square foot. 115 Lake Windward Landing is a home located in Fulton County with nearby schools including Creek View Elementary School, Webb Bridge Middle School, and Alpharetta High School.
Ownership History
Date
Name
Owned For
Owner Type
Purchase Details
Closed on
Sep 1, 2011
Sold by
Bac Home Loans Servicing L
Bought by
Day Rober M and Day Sunhee
Current Estimated Value
Home Financials for this Owner
Home Financials are based on the most recent Mortgage that was taken out on this home.
Original Mortgage
$311,100
Outstanding Balance
$214,459
Interest Rate
4.4%
Mortgage Type
New Conventional
Estimated Equity
$927,338
Purchase Details
Closed on
May 3, 2011
Sold by
Mills Timothy J
Bought by
Bac Home Loans Servicing Lp
Purchase Details
Closed on
Jul 18, 2003
Sold by
Visual Technologies Inc
Bought by
Mills Timothy J
Home Financials for this Owner
Home Financials are based on the most recent Mortgage that was taken out on this home.
Original Mortgage
$412,000
Interest Rate
4%
Mortgage Type
New Conventional
Purchase Details
Closed on
Aug 23, 2002
Sold by
Lamb Jeffrey J and Lamb Andrea E
Bought by
Visual Technologies Inc
Create a Home Valuation Report for This Property
The Home Valuation Report is an in-depth analysis detailing your home's value as well as a comparison with similar homes in the area
Home Values in the Area
Average Home Value in this Area
Purchase History
| Date | Buyer | Sale Price | Title Company |
|---|---|---|---|
| Day Rober M | $366,000 | -- | |
| Bac Home Loans Servicing Lp | $396,000 | -- | |
| Mills Timothy J | $515,000 | -- | |
| Visual Technologies Inc | $515,000 | -- |
Source: Public Records
Mortgage History
| Date | Status | Borrower | Loan Amount |
|---|---|---|---|
| Open | Day Rober M | $311,100 | |
| Previous Owner | Mills Timothy J | $412,000 |
Source: Public Records
Tax History Compared to Growth
Tax History
| Year | Tax Paid | Tax Assessment Tax Assessment Total Assessment is a certain percentage of the fair market value that is determined by local assessors to be the total taxable value of land and additions on the property. | Land | Improvement |
|---|---|---|---|---|
| 2025 | $1,249 | $723,280 | $27,800 | $695,480 |
| 2023 | $1,249 | $343,040 | $113,280 | $229,760 |
| 2022 | $5,129 | $310,280 | $61,720 | $248,560 |
| 2021 | $6,208 | $277,480 | $35,400 | $242,080 |
| 2020 | $6,186 | $231,560 | $33,880 | $197,680 |
| 2019 | $1,082 | $248,520 | $40,760 | $207,760 |
| 2018 | $4,891 | $207,720 | $51,680 | $156,040 |
| 2017 | $5,039 | $207,720 | $51,680 | $156,040 |
| 2016 | $5,015 | $207,720 | $51,680 | $156,040 |
| 2015 | $4,239 | $207,720 | $51,680 | $156,040 |
| 2014 | $3,799 | $136,680 | $30,000 | $106,680 |
Source: Public Records
Map
Nearby Homes
- 1055 Creek Ridge Pointe
- 2175 Lake Shore Landing
- 2195 Lake Shore Landing
- 1125 Lake Shore Overlook
- 1605 Spinnaker Dr
- 6165 Pin Oak Ln
- 2010 Lake Shore Landing
- 1585 Spinnaker Dr
- 1225 Bay Pointe Terrace
- 10 Club Ct
- 1200 Bay Pointe Terrace
- 8110 Willow Tree Way
- 425 Red Jacket Way
- 415 Prestwick Ct
- 290 Ardsley Ln
- 1315 Portmarnock Dr
- 520 Flying Scot Way
- 1075 Carnoustie Ln
- 7845 Crownpoint Dr
- 125 Lake Windward Landing
- 105 Lake Windward Landing
- 100 Lake Windward Landing
- 145 Lake Windward Landing
- 1025 Signal Point
- 1025 Signal Pointe
- 155 Lake Windward Landing
- 1050 Lake Windward Overlook
- 110 Lake Windward Landing
- 1100 Creek Ridge
- 1100 Creek Ridge Pointe
- 1015 Signal Pointe
- 1060 Lake Windward Overlook
- 0 Signal Point Unit 7286382
- 0 Signal Point Unit 7248640
- 0 Signal Point Unit 7345473
- 0 Signal Point Unit 7303608
- 0 Signal Point
- 1035 Signal Point