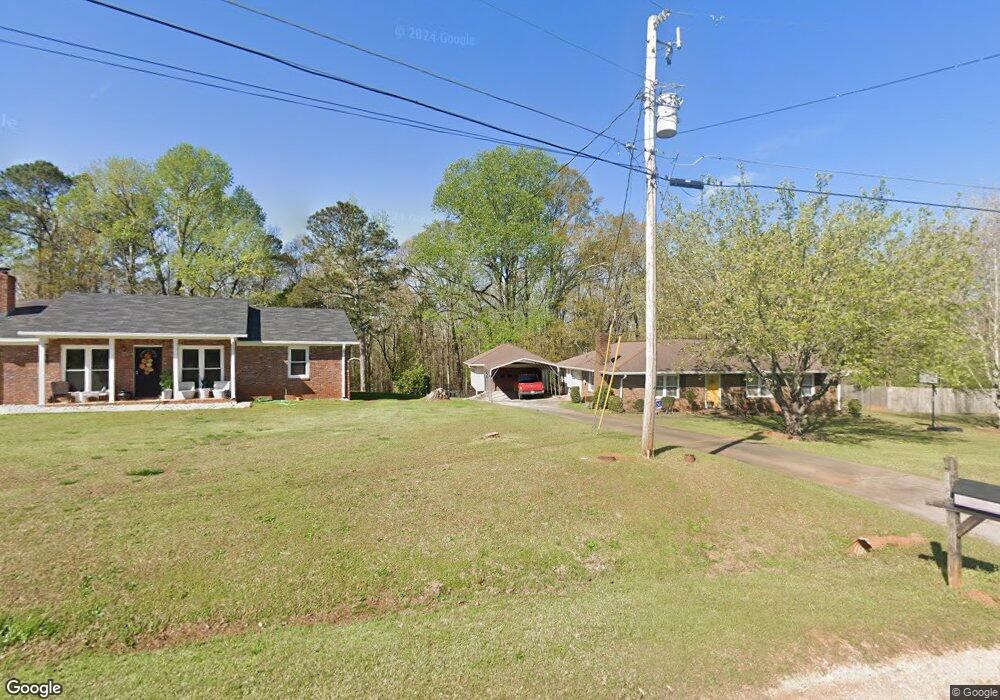
115 Lakecrest Dr Lagrange, GA 30240
Estimated Value: $232,696 - $258,000
3
Beds
2
Baths
1,744
Sq Ft
$142/Sq Ft
Est. Value
About This Home
This home is located at 115 Lakecrest Dr, Lagrange, GA 30240 and is currently estimated at $247,924, approximately $142 per square foot. 115 Lakecrest Dr is a home located in Troup County with nearby schools including Long Cane Elementary School, Berta Weathersbee Elementary School, and Whitesville Road Elementary School.
Ownership History
Date
Name
Owned For
Owner Type
Purchase Details
Closed on
Aug 1, 2002
Sold by
Edna E Lester Rushforth
Bought by
Haynes Ruben L
Current Estimated Value
Purchase Details
Closed on
Dec 3, 1990
Sold by
Rushforth Wilfred
Bought by
Edna E Lester Rushforth
Purchase Details
Closed on
Aug 19, 1986
Sold by
Spinks-Brown Realty Assocs
Bought by
Rushforth Wilfred
Purchase Details
Closed on
Aug 1, 1986
Sold by
Kraemer Charles P and Kraemer Janice H
Bought by
Spinks-Brown Realty Assocs
Purchase Details
Closed on
Jul 14, 1978
Sold by
Davis William Bradley
Bought by
Kraemer Charles P and Kraemer Janice H
Purchase Details
Closed on
May 14, 1976
Sold by
Knight & Knight Of Laginc
Bought by
Davis William Bradley
Purchase Details
Closed on
May 13, 1976
Sold by
Whitaker Homes Inc
Bought by
Knight & Knight Of Laginc
Purchase Details
Closed on
Dec 8, 1975
Sold by
T and Properties,Ltd C
Bought by
Whitaker Homes Inc
Create a Home Valuation Report for This Property
The Home Valuation Report is an in-depth analysis detailing your home's value as well as a comparison with similar homes in the area
Purchase History
| Date | Buyer | Sale Price | Title Company |
|---|---|---|---|
| Haynes Ruben L | $96,500 | -- | |
| Edna E Lester Rushforth | -- | -- | |
| Rushforth Wilfred | $54,500 | -- | |
| Spinks-Brown Realty Assocs | $54,400 | -- | |
| Kraemer Charles P | $42,200 | -- | |
| Davis William Bradley | -- | -- | |
| Knight & Knight Of Laginc | -- | -- | |
| Whitaker Homes Inc | -- | -- |
Source: Public Records
Tax History
| Year | Tax Paid | Tax Assessment Tax Assessment Total Assessment is a certain percentage of the fair market value that is determined by local assessors to be the total taxable value of land and additions on the property. | Land | Improvement |
|---|---|---|---|---|
| 2025 | $1,955 | $91,352 | $10,000 | $81,352 |
| 2024 | $1,471 | $63,900 | $8,000 | $55,900 |
| 2023 | $976 | $63,636 | $8,000 | $55,636 |
| 2022 | $1,554 | $57,676 | $8,000 | $49,676 |
| 2021 | $1,297 | $45,000 | $8,000 | $37,000 |
| 2020 | $1,297 | $45,000 | $8,000 | $37,000 |
| 2019 | $1,094 | $38,264 | $6,000 | $32,264 |
| 2018 | $1,006 | $35,352 | $6,000 | $29,352 |
| 2017 | $1,006 | $35,352 | $6,000 | $29,352 |
| 2016 | $975 | $34,310 | $6,000 | $28,310 |
| 2015 | $977 | $34,310 | $6,000 | $28,310 |
| 2014 | $933 | $32,820 | $6,000 | $26,820 |
| 2013 | -- | $34,868 | $6,000 | $28,868 |
Source: Public Records
Map
Nearby Homes
- 113 Colonial Ct
- 20 Hill Rd
- 36 Hill Rd
- 104 Independence Ct
- 311 Cumberland Dr
- 640 Hudson Rd
- 101 Ivy Springs Dr
- 3658 W Point Rd
- 245 Teaver Rd
- 300 Cumberland Dr
- 0 Glass Bridge Rd Unit 10679358
- 474 Newton Rd
- 16 River Point Dr
- 40 River Point Dr
- 129 Angela East Dr
- 4.51 ACRES Whatley Rd N
- 0 Deming St Unit 10550189
- 98 Hearn Rd
- 808 S Fling Rd
- 851 Vernon Ferry Rd
- 113 Lakecrest Dr
- 117 Lakecrest Dr
- 111 Lakecrest Dr
- 116 Lakecrest Dr
- 119 Lakecrest Dr
- 109 Lakecrest Dr
- 118 Lakecrest Dr
- 106 Lakecrest Dr
- 107 Lakecrest Dr
- 121 Lakecrest Dr
- 120 Lakecrest Dr
- 201 Lakecrest Ct
- 123 Lakecrest Dr
- 105 Lakecrest Dr
- 122 Lakecrest Dr
- 203 Lakecrest Ct Unit 9
- 124 Lakecrest Dr
- 103 Lakecrest Dr
- 204 Lakecrest Ct
- 102 Lakecrest Dr
Your Personal Tour Guide
Ask me questions while you tour the home.