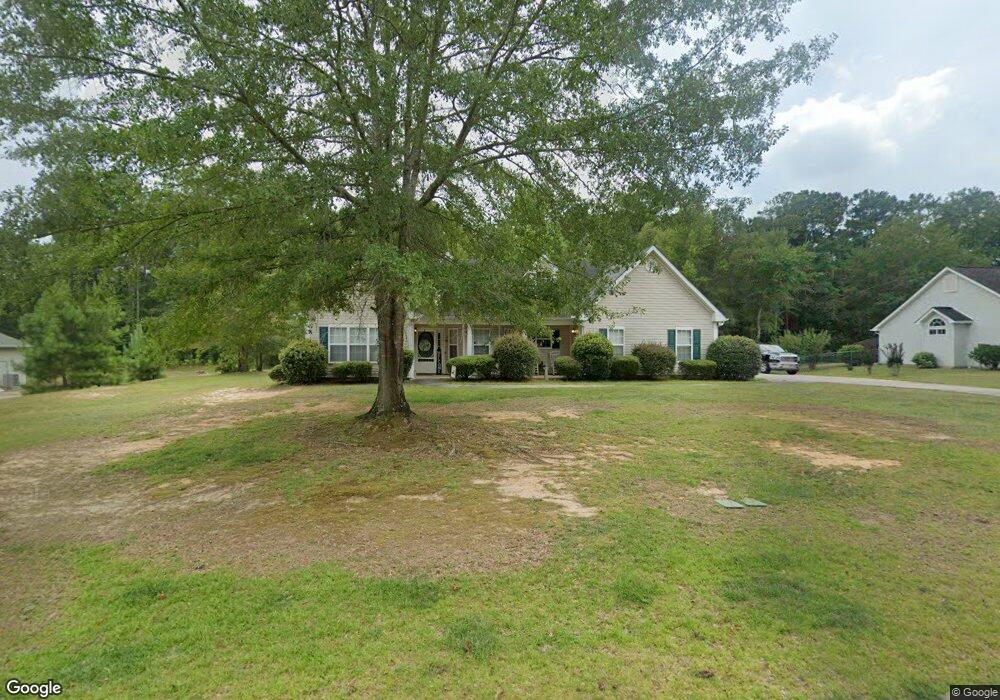
115 Lambdin Cir Barnesville, GA 30204
Estimated Value: $256,695 - $365,000
3
Beds
2
Baths
17,500
Sq Ft
$17/Sq Ft
Est. Value
About This Home
This home is located at 115 Lambdin Cir, Barnesville, GA 30204 and is currently estimated at $296,174, approximately $16 per square foot. 115 Lambdin Cir is a home located in Lamar County with nearby schools including Lamar County Primary School, Lamar County Elementary School, and Lamar County Middle School.
Ownership History
Date
Name
Owned For
Owner Type
Purchase Details
Closed on
Jun 12, 2018
Sold by
Jett Karen M
Bought by
Smith Patsy J
Current Estimated Value
Home Financials for this Owner
Home Financials are based on the most recent Mortgage that was taken out on this home.
Original Mortgage
$159,505
Outstanding Balance
$138,254
Interest Rate
4.6%
Mortgage Type
New Conventional
Estimated Equity
$157,920
Purchase Details
Closed on
Aug 19, 2011
Sold by
Federal National Mortgage Association
Bought by
Jett Karen M
Home Financials for this Owner
Home Financials are based on the most recent Mortgage that was taken out on this home.
Original Mortgage
$87,213
Interest Rate
5.5%
Mortgage Type
FHA
Purchase Details
Closed on
May 3, 2011
Sold by
Barlow Danny
Bought by
Federal National Mortgage Association
Purchase Details
Closed on
Oct 4, 2002
Sold by
Welchel Const Inc
Bought by
Barlow Danny
Create a Home Valuation Report for This Property
The Home Valuation Report is an in-depth analysis detailing your home's value as well as a comparison with similar homes in the area
Home Values in the Area
Average Home Value in this Area
Purchase History
| Date | Buyer | Sale Price | Title Company |
|---|---|---|---|
| Smith Patsy J | $167,900 | -- | |
| Jett Karen M | $93,000 | -- | |
| Federal National Mortgage Association | $109,580 | -- | |
| Barlow Danny | $126,900 | -- |
Source: Public Records
Mortgage History
| Date | Status | Borrower | Loan Amount |
|---|---|---|---|
| Open | Smith Patsy J | $159,505 | |
| Previous Owner | Federal National Mortgage Association | $87,213 | |
| Previous Owner | Federal National Mortgage Association | $7,500 |
Source: Public Records
Tax History Compared to Growth
Tax History
| Year | Tax Paid | Tax Assessment Tax Assessment Total Assessment is a certain percentage of the fair market value that is determined by local assessors to be the total taxable value of land and additions on the property. | Land | Improvement |
|---|---|---|---|---|
| 2024 | $2,431 | $84,820 | $6,800 | $78,020 |
| 2023 | $2,502 | $81,060 | $6,800 | $74,260 |
| 2022 | $2,057 | $74,519 | $6,800 | $67,719 |
| 2021 | $1,808 | $60,141 | $6,800 | $53,341 |
| 2020 | $1,803 | $56,950 | $6,800 | $50,150 |
| 2019 | $1,747 | $56,950 | $6,800 | $50,150 |
| 2018 | $1,357 | $46,429 | $6,800 | $39,629 |
| 2017 | $1,350 | $46,429 | $6,800 | $39,629 |
| 2016 | $1,351 | $46,429 | $6,800 | $39,629 |
| 2015 | $1,345 | $46,429 | $6,800 | $39,629 |
| 2014 | $1,304 | $46,429 | $6,800 | $39,629 |
| 2013 | -- | $46,428 | $6,800 | $39,628 |
Source: Public Records
Map
Nearby Homes
- 0 Hannah Ct Unit LOT 13 10587187
- 0 Hannah Ct Unit LOT 10 10587183
- 0 Hannah Ct Unit LOT 14 10587190
- 0 Hannah St Unit LOT 1 10587177
- 0 Bush St Unit 10582678
- 0 Martin Luther King Junior Pkwy
- 108 Bradley Cir
- 110 Bradley Cir
- 205 Mathews St
- 209 Mathews St
- 308 Moye St
- 0 Roberts Rd Unit 10593586
- 303 Carleeta St
- 202 Northside Dr
- 205 Pine St
- 4 Jackson St
- 107 1st St
- 306 Spencer St
- 205 Georgia Ave
- 150 Georgia Ave
- 117 Lambdin Cir
- 113 Lambdin Cir Unit 8
- 113 Lambdin Cir
- 120 Lambdin Cir
- 119 Lambdin Cir
- 111 Lambdin Cir
- 122 Lambdin Cir
- 122 Lambdin Cir
- 118 Lambdin Cir
- 121 Lambdin Cir Unit 15C
- 121 Lambdin Cir
- 109 Lambdin Cir
- 116 Lambdin Cir
- 124 Lambdin Cir
- 124 Lambdin Cir Unit A20
- 107 Lambdin Cir
- 114 Lambdin Cir
- 105 Lambdin Cir
- 128 Lambdin Cir
- 125 Lambdin Cir