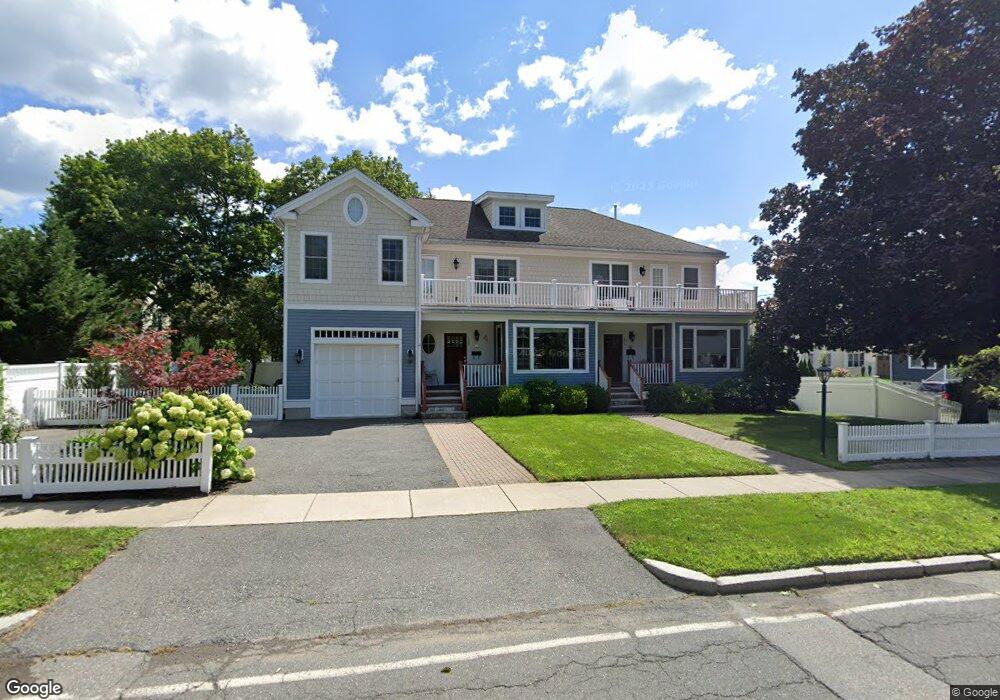
115 Loring Ave Unit 115 Winchester, MA 01890
Estimated Value: $1,151,000 - $1,599,000
3
Beds
3
Baths
3,423
Sq Ft
$402/Sq Ft
Est. Value
About This Home
This home is located at 115 Loring Ave Unit 115, Winchester, MA 01890 and is currently estimated at $1,376,459, approximately $402 per square foot. 115 Loring Ave Unit 115 is a home located in Middlesex County with nearby schools including Lynch Elementary School, McCall Middle School, and Winchester High School.
Ownership History
Date
Name
Owned For
Owner Type
Purchase Details
Closed on
Jun 10, 2024
Sold by
Boufounos Petros and Karayannacos Hellas
Bought by
Boufounos Karayannacos Lt and Boufounos
Current Estimated Value
Purchase Details
Closed on
Apr 14, 2016
Sold by
Sharon C Moynihan Ret
Bought by
Boufounos Petros and Karayannacos Hellas
Home Financials for this Owner
Home Financials are based on the most recent Mortgage that was taken out on this home.
Original Mortgage
$625,000
Interest Rate
3.64%
Mortgage Type
Unknown
Purchase Details
Closed on
Jan 26, 2009
Sold by
Moynihan Joseph C and Moynihan Sharon C
Bought by
Joseph C Moynihan Ret and Moynihan
Purchase Details
Closed on
May 17, 2007
Sold by
Nardone Prop Grp Lp
Bought by
Moynihan Joseph C and Moynihan Sharon C
Home Financials for this Owner
Home Financials are based on the most recent Mortgage that was taken out on this home.
Original Mortgage
$350,000
Interest Rate
6.18%
Mortgage Type
Purchase Money Mortgage
Create a Home Valuation Report for This Property
The Home Valuation Report is an in-depth analysis detailing your home's value as well as a comparison with similar homes in the area
Home Values in the Area
Average Home Value in this Area
Purchase History
| Date | Buyer | Sale Price | Title Company |
|---|---|---|---|
| Boufounos Karayannacos Lt | -- | None Available | |
| Boufounos Karayannacos Lt | -- | None Available | |
| Boufounos Petros | $785,000 | -- | |
| Joseph C Moynihan Ret | -- | -- | |
| Joseph C Moynihan Ret | -- | -- | |
| Moynihan Joseph C | $636,000 | -- | |
| Moynihan Joseph C | $636,000 | -- |
Source: Public Records
Mortgage History
| Date | Status | Borrower | Loan Amount |
|---|---|---|---|
| Previous Owner | Boufounos Petros | $625,000 | |
| Previous Owner | Moynihan Joseph C | $350,000 |
Source: Public Records
Tax History Compared to Growth
Tax History
| Year | Tax Paid | Tax Assessment Tax Assessment Total Assessment is a certain percentage of the fair market value that is determined by local assessors to be the total taxable value of land and additions on the property. | Land | Improvement |
|---|---|---|---|---|
| 2025 | $123 | $1,109,700 | $0 | $1,109,700 |
| 2024 | $12,089 | $1,067,000 | $0 | $1,067,000 |
| 2023 | $12,116 | $1,026,800 | $0 | $1,026,800 |
| 2022 | $11,887 | $950,200 | $0 | $950,200 |
| 2021 | $10,932 | $852,100 | $0 | $852,100 |
| 2020 | $9,238 | $745,600 | $0 | $745,600 |
| 2019 | $9,029 | $745,600 | $0 | $745,600 |
| 2018 | $8,899 | $730,000 | $0 | $730,000 |
| 2017 | $8,628 | $702,600 | $0 | $702,600 |
| 2016 | $7,294 | $624,500 | $0 | $624,500 |
| 2015 | $7,401 | $609,600 | $0 | $609,600 |
| 2014 | $7,020 | $554,500 | $0 | $554,500 |
Source: Public Records
Map
Nearby Homes
- 29 Shepard Ct
- 171 Swanton St Unit 73
- 2 George Rd Unit 2
- 20 Arthur St
- 237 Swanton St
- 14 Cross St
- 95 Irving St
- 200 Swanton St Unit 228
- 200 Swanton St Unit 636
- 200 Swanton St Unit 234
- 200 Swanton St Unit T28
- 62 Richardson St
- 44 Main St
- 18 Raymond Place
- 61 Mount Pleasant St
- 149 Horn Pond Brook Rd
- 32 Oak St
- 14 Ash St
- 666 Main St Unit 312
- 666 Main St Unit 315
- 115 Loring Ave
- 111 Loring Ave
- 23 Wendell St
- 103 Loring Ave
- 119 Loring Ave Unit 121
- 119 Loring Ave Unit 119
- 119 Loring Ave Unit 1
- 121 Loring Ave Unit 121
- 121 Loring Ave Unit 1
- 121 Loring Ave
- 121 Loring Ave
- 108 Loring Ave
- 19 Wendell St
- 24 Wendell St
- 284 Cross St Unit C
- 284 Cross St Unit B
- 284 Cross St Unit A
- 284 Cross St
- 284 Cross St Unit 3
- 284 Cross St Unit 2