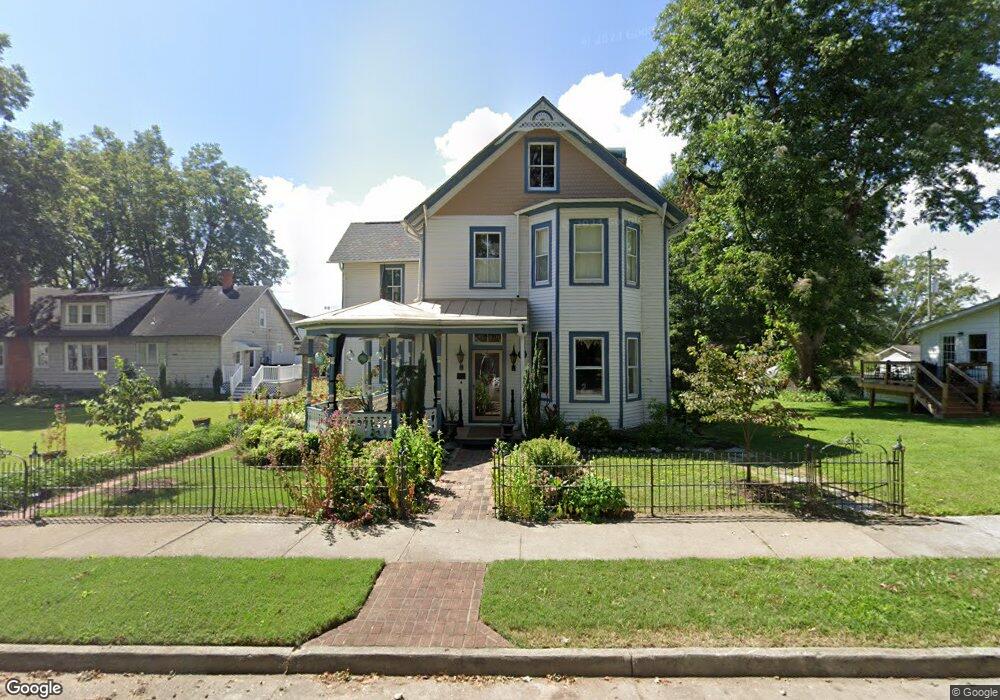
115 Main St West Point, VA 23181
Estimated Value: $295,000 - $427,000
5
Beds
3
Baths
2,609
Sq Ft
$138/Sq Ft
Est. Value
About This Home
This home is located at 115 Main St, West Point, VA 23181 and is currently estimated at $360,137, approximately $138 per square foot. 115 Main St is a home located in King William County with nearby schools including West Point Elementary School, West Point Middle School, and West Point High School.
Ownership History
Date
Name
Owned For
Owner Type
Purchase Details
Closed on
Sep 22, 2009
Sold by
Malcolm Hoffman Mary and Pillsbury John Forrest
Bought by
Brockwell James N
Current Estimated Value
Home Financials for this Owner
Home Financials are based on the most recent Mortgage that was taken out on this home.
Original Mortgage
$208,000
Outstanding Balance
$136,652
Interest Rate
5.28%
Mortgage Type
New Conventional
Estimated Equity
$223,485
Create a Home Valuation Report for This Property
The Home Valuation Report is an in-depth analysis detailing your home's value as well as a comparison with similar homes in the area
Home Values in the Area
Average Home Value in this Area
Purchase History
| Date | Buyer | Sale Price | Title Company |
|---|---|---|---|
| Brockwell James N | $260,000 | -- |
Source: Public Records
Mortgage History
| Date | Status | Borrower | Loan Amount |
|---|---|---|---|
| Open | Brockwell James N | $208,000 |
Source: Public Records
Tax History Compared to Growth
Tax History
| Year | Tax Paid | Tax Assessment Tax Assessment Total Assessment is a certain percentage of the fair market value that is determined by local assessors to be the total taxable value of land and additions on the property. | Land | Improvement |
|---|---|---|---|---|
| 2025 | $903 | $296,000 | $50,000 | $246,000 |
| 2024 | $799 | $296,000 | $50,000 | $246,000 |
| 2023 | $799 | $296,000 | $50,000 | $246,000 |
| 2022 | $794 | $211,700 | $50,000 | $161,700 |
| 2021 | $804 | $211,700 | $50,000 | $161,700 |
| 2020 | $804 | $262,700 | $57,500 | $205,200 |
| 2019 | $804 | $210,900 | $50,000 | $160,900 |
| 2018 | $826 | $211,700 | $50,000 | $161,700 |
| 2017 | $847 | $211,700 | $50,000 | $161,700 |
| 2016 | $868 | $211,700 | $50,000 | $161,700 |
| 2015 | $910 | $244,500 | $50,000 | $194,500 |
| 2014 | $836 | $0 | $0 | $0 |
Source: Public Records
Map
Nearby Homes
- 200 Lee St
- 520 Main St
- 1213 Kirby St
- 0 14th and Kirby St
- 515 18th St
- 7999 Georgia Ave
- 8041 Georgia Ave
- 19441 York Rd
- Lot 52G Georgia Ave
- Lot 52F Georgia Ave
- LOT 53B Georgia Ave
- 262 Goulders Creek Rd
- 230 Glen St
- Lot 23 Glen St
- 000 Glen St
- .21ac Glen St
- 00 Glen St
- 8325 Mill Creek Rd Unit A
- 19041 Eltham Rd
- 605 Rivergate Terrace