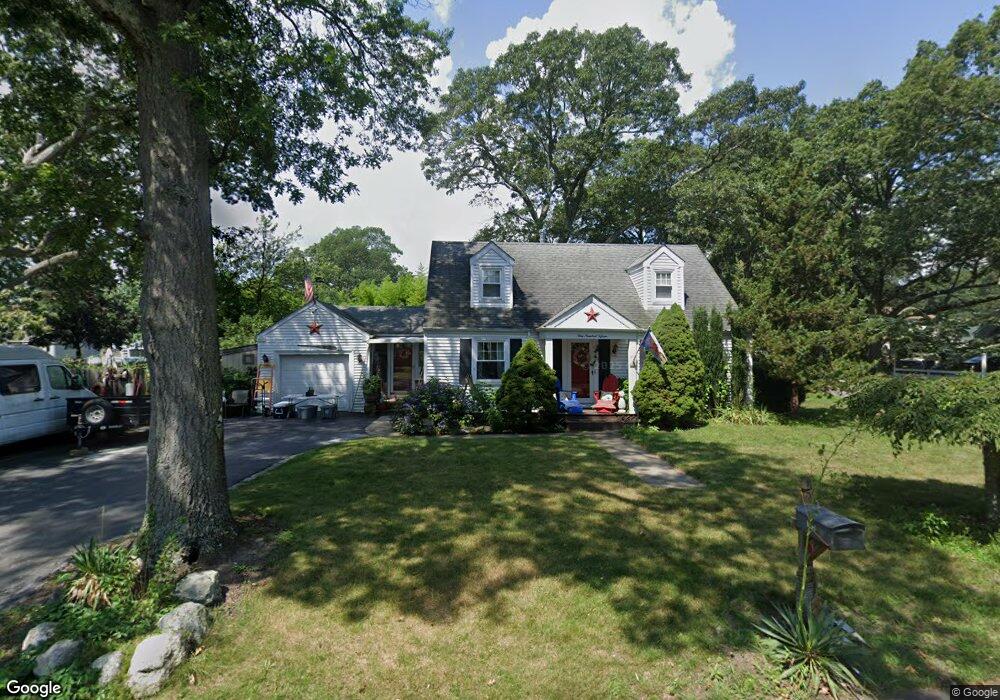
115 Manning St Warwick, RI 02889
Oakland Beach NeighborhoodEstimated Value: $401,494 - $477,000
3
Beds
2
Baths
1,600
Sq Ft
$267/Sq Ft
Est. Value
About This Home
This home is located at 115 Manning St, Warwick, RI 02889 and is currently estimated at $427,874, approximately $267 per square foot. 115 Manning St is a home located in Kent County with nearby schools including Saint Kevin School and Bishop Hendricken High School.
Ownership History
Date
Name
Owned For
Owner Type
Purchase Details
Closed on
Mar 24, 2006
Sold by
Moynihan Michael R and Moynihan Kerri L
Bought by
Iozzi Steven F and Iozzi Jessica L
Current Estimated Value
Home Financials for this Owner
Home Financials are based on the most recent Mortgage that was taken out on this home.
Original Mortgage
$244,000
Interest Rate
6.28%
Mortgage Type
Purchase Money Mortgage
Purchase Details
Closed on
Sep 16, 1999
Sold by
Furlong Michael W and Furlong Jayne E
Bought by
Moynihan Michael R and Moynihan Kerri L
Create a Home Valuation Report for This Property
The Home Valuation Report is an in-depth analysis detailing your home's value as well as a comparison with similar homes in the area
Home Values in the Area
Average Home Value in this Area
Purchase History
| Date | Buyer | Sale Price | Title Company |
|---|---|---|---|
| Iozzi Steven F | $305,000 | -- | |
| Moynihan Michael R | $110,500 | -- |
Source: Public Records
Mortgage History
| Date | Status | Borrower | Loan Amount |
|---|---|---|---|
| Open | Moynihan Michael R | $306,530 | |
| Closed | Moynihan Michael R | $244,000 |
Source: Public Records
Tax History
| Year | Tax Paid | Tax Assessment Tax Assessment Total Assessment is a certain percentage of the fair market value that is determined by local assessors to be the total taxable value of land and additions on the property. | Land | Improvement |
|---|---|---|---|---|
| 2025 | $4,909 | $386,500 | $105,100 | $281,400 |
| 2024 | $4,596 | $317,600 | $91,300 | $226,300 |
| 2023 | $4,507 | $317,600 | $91,300 | $226,300 |
| 2022 | $4,222 | $225,400 | $54,800 | $170,600 |
| 2021 | $4,222 | $225,400 | $54,800 | $170,600 |
| 2020 | $4,222 | $225,400 | $54,800 | $170,600 |
| 2019 | $4,222 | $225,400 | $54,800 | $170,600 |
| 2018 | $3,987 | $191,700 | $54,800 | $136,900 |
| 2017 | $3,880 | $191,700 | $54,800 | $136,900 |
| 2016 | $3,880 | $191,700 | $54,800 | $136,900 |
| 2015 | $3,886 | $187,300 | $63,600 | $123,700 |
| 2014 | $3,757 | $187,300 | $63,600 | $123,700 |
| 2013 | $3,707 | $187,300 | $63,600 | $123,700 |
Source: Public Records
Map
Nearby Homes
- 0 Sea View Dr
- 107 Coburn St
- 188 Wood St
- 75 Northup St
- 52 Hazard Ave
- 81 Pinehurst Ave
- 79 Pinehurst Ave
- 73 Pinehurst Ave
- 71 Pinehurst Ave
- 83 Ottawa Ave
- 357 Pequot Ave
- 176 Canfield Ave
- 79 Suburban Pkwy
- 90 Huron St
- 165 Canfield Ave
- 201 Hollis Ave
- 195 Oakland Beach Ave
- 72 Hollis Ave
- 9 Kenneth Ave
- 585 Meadow View Ave
- 108 Brush Neck Ave
- 0 Brush Neck Ave
- 121 Manning St
- 114 Brush Neck Ave
- 209 Coburn St
- 112 Manning St
- 118 Manning St
- 99 Brush Neck Ave
- 120 Brush Neck Ave
- 115 Brush Neck Ave
- 221 Coburn St
- 82 Brush Neck Ave
- 94 Manning St
- 124 Brush Neck Ave
- 185 Coburn St
- 134 Wood St
- 142 Wood St
- 146 Wood St
- 202 Coburn St
- 130 Brush Neck Ave
Your Personal Tour Guide
Ask me questions while you tour the home.