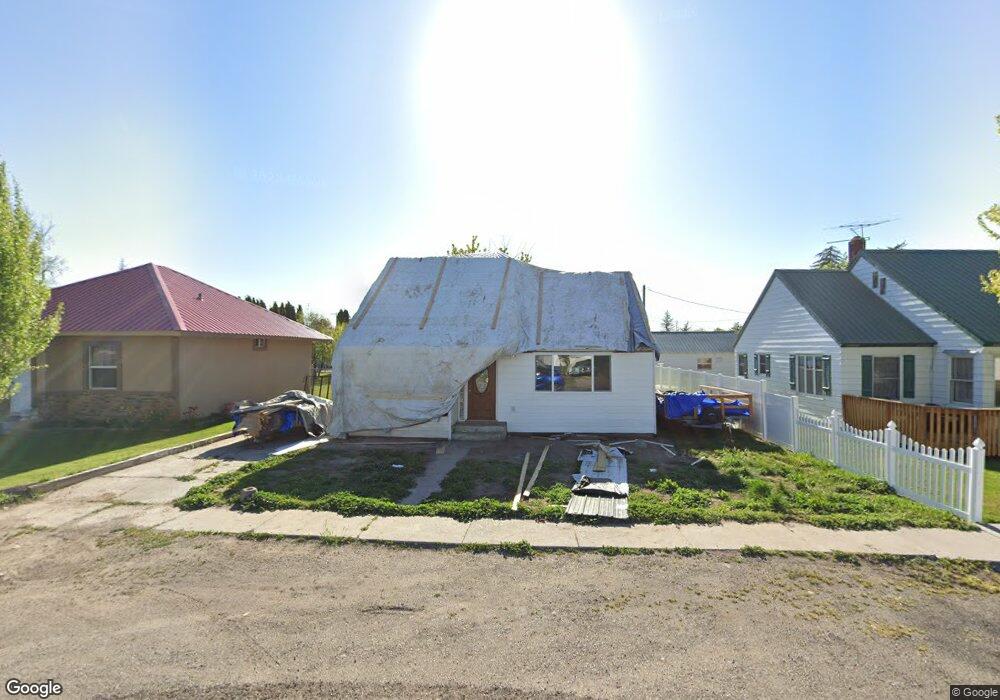
Estimated Value: $143,000 - $188,000
2
Beds
1
Bath
820
Sq Ft
$202/Sq Ft
Est. Value
About This Home
This home is located at 115 N 2nd St W, Paul, ID 83347 and is currently estimated at $165,322, approximately $201 per square foot. 115 N 2nd St W is a home with nearby schools including Paul Elementary School, Minico Senior High School, and Artec Charter School.
Ownership History
Date
Name
Owned For
Owner Type
Purchase Details
Closed on
Jan 2, 2024
Sold by
Problem Sold Llc
Bought by
Vega Alejandro and Vega Geraldine
Current Estimated Value
Home Financials for this Owner
Home Financials are based on the most recent Mortgage that was taken out on this home.
Original Mortgage
$96,000
Interest Rate
7.63%
Mortgage Type
New Conventional
Purchase Details
Closed on
Nov 28, 2023
Sold by
Girten Terry K
Bought by
Problem Sold Llc and Girten
Home Financials for this Owner
Home Financials are based on the most recent Mortgage that was taken out on this home.
Original Mortgage
$96,000
Interest Rate
7.63%
Mortgage Type
New Conventional
Create a Home Valuation Report for This Property
The Home Valuation Report is an in-depth analysis detailing your home's value as well as a comparison with similar homes in the area
Home Values in the Area
Average Home Value in this Area
Purchase History
| Date | Buyer | Sale Price | Title Company |
|---|---|---|---|
| Vega Alejandro | -- | Titleone | |
| Problem Sold Llc | -- | Pioneer Title |
Source: Public Records
Mortgage History
| Date | Status | Borrower | Loan Amount |
|---|---|---|---|
| Closed | Problem Sold Llc | $96,000 |
Source: Public Records
Tax History Compared to Growth
Tax History
| Year | Tax Paid | Tax Assessment Tax Assessment Total Assessment is a certain percentage of the fair market value that is determined by local assessors to be the total taxable value of land and additions on the property. | Land | Improvement |
|---|---|---|---|---|
| 2024 | $797 | $86,537 | $23,797 | $62,740 |
| 2023 | $733 | $73,817 | $23,797 | $50,020 |
| 2022 | $790 | $67,917 | $20,717 | $47,200 |
| 2021 | $672 | $46,962 | $10,662 | $36,300 |
| 2020 | $642 | $42,524 | $8,114 | $34,410 |
| 2019 | $691 | $42,524 | $0 | $0 |
| 2018 | $595 | $34,114 | $8,114 | $26,000 |
| 2017 | $699 | $35,427 | $6,477 | $28,950 |
| 2016 | $480 | $0 | $0 | $0 |
| 2015 | -- | $0 | $0 | $0 |
| 2014 | -- | $0 | $0 | $0 |
| 2012 | -- | $0 | $0 | $0 |
Source: Public Records
Map
Nearby Homes