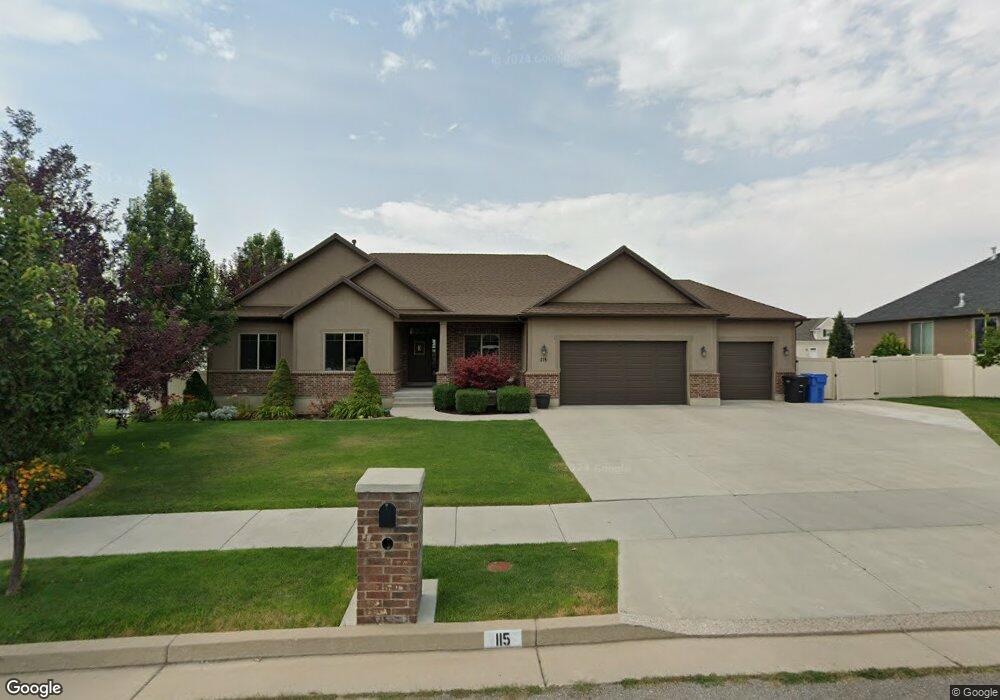
115 N 760 E Hyde Park, UT 84318
Estimated Value: $706,003 - $784,000
Studio
--
Bath
2,069
Sq Ft
$366/Sq Ft
Est. Value
About This Home
This home is located at 115 N 760 E, Hyde Park, UT 84318 and is currently estimated at $756,251, approximately $365 per square foot. 115 N 760 E is a home with nearby schools including North Park School, Cedar Ridge School, and North Cache Middle School.
Ownership History
Date
Name
Owned For
Owner Type
Purchase Details
Closed on
Jun 23, 2020
Sold by
Keller Bennett D and Keller Lori
Bought by
Keller Bennett and Keller Lori
Current Estimated Value
Purchase Details
Closed on
Sep 25, 2014
Sold by
Mcdonald Jarad John and Mcdonald Leslie
Bought by
Keller Bennett D and Keller Lori
Home Financials for this Owner
Home Financials are based on the most recent Mortgage that was taken out on this home.
Original Mortgage
$185,000
Outstanding Balance
$59,698
Interest Rate
4.09%
Mortgage Type
New Conventional
Estimated Equity
$696,553
Purchase Details
Closed on
Feb 19, 2013
Sold by
Mcdonald Jarad
Bought by
Mcdonald Jarad John and Mcdonald Leslie
Home Financials for this Owner
Home Financials are based on the most recent Mortgage that was taken out on this home.
Original Mortgage
$264,000
Interest Rate
3.36%
Mortgage Type
New Conventional
Purchase Details
Closed on
Jun 20, 2011
Sold by
Foothills Construction & Development Inc
Bought by
Mcdonald Jarad John and Mcdonald Leslie
Create a Home Valuation Report for This Property
The Home Valuation Report is an in-depth analysis detailing your home's value as well as a comparison with similar homes in the area
Home Values in the Area
Average Home Value in this Area
Purchase History
| Date | Buyer | Sale Price | Title Company |
|---|---|---|---|
| Keller Bennett | -- | None Available | |
| Keller Bennett D | -- | Northern Title Company | |
| Mcdonald Jarad John | -- | Northern Title Company | |
| Mcdonald Jarad | -- | Northern Title Company | |
| Mcdonald Jarad John | -- | Pinnacle Title Ins Agency |
Source: Public Records
Mortgage History
| Date | Status | Borrower | Loan Amount |
|---|---|---|---|
| Open | Keller Bennett D | $185,000 | |
| Previous Owner | Mcdonald Jarad | $264,000 |
Source: Public Records
Tax History
| Year | Tax Paid | Tax Assessment Tax Assessment Total Assessment is a certain percentage of the fair market value that is determined by local assessors to be the total taxable value of land and additions on the property. | Land | Improvement |
|---|---|---|---|---|
| 2025 | $3,063 | $422,270 | $0 | $0 |
| 2024 | $3,364 | $427,665 | $0 | $0 |
| 2023 | $3,505 | $423,830 | $0 | $0 |
| 2022 | $3,645 | $423,830 | $0 | $0 |
| 2021 | $2,724 | $497,598 | $110,000 | $387,598 |
| 2020 | $2,574 | $447,042 | $110,000 | $337,042 |
| 2019 | $2,712 | $447,041 | $110,000 | $337,041 |
| 2018 | $2,264 | $365,930 | $65,000 | $300,930 |
| 2017 | $2,273 | $193,380 | $0 | $0 |
| 2016 | $2,305 | $157,700 | $0 | $0 |
| 2015 | $1,860 | $157,700 | $0 | $0 |
| 2014 | $1,813 | $157,700 | $0 | $0 |
| 2013 | -- | $154,950 | $0 | $0 |
Source: Public Records
Map
Nearby Homes
- 116 N 820 E
- 1087 E 160 N
- 458 W Madison St S
- 1130 E 245 N
- 201 N 1000 E Unit 19
- 1109 E 245 N
- 830 E 410 N Unit 161
- 454 W Madison St S
- 1070 E 200 N Unit 24
- 480 N 729 E
- 640 S 175 E
- 150 E 650 S
- 835 E 410 N Unit 156
- 635 S 125 E Unit 120
- 626 S 125 E
- 613 S 175 E
- 623 S 125 E
- 108 N 900 E
- 803 E 160 N Unit 1
- 882 E 160 N Unit 4
Your Personal Tour Guide
Ask me questions while you tour the home.