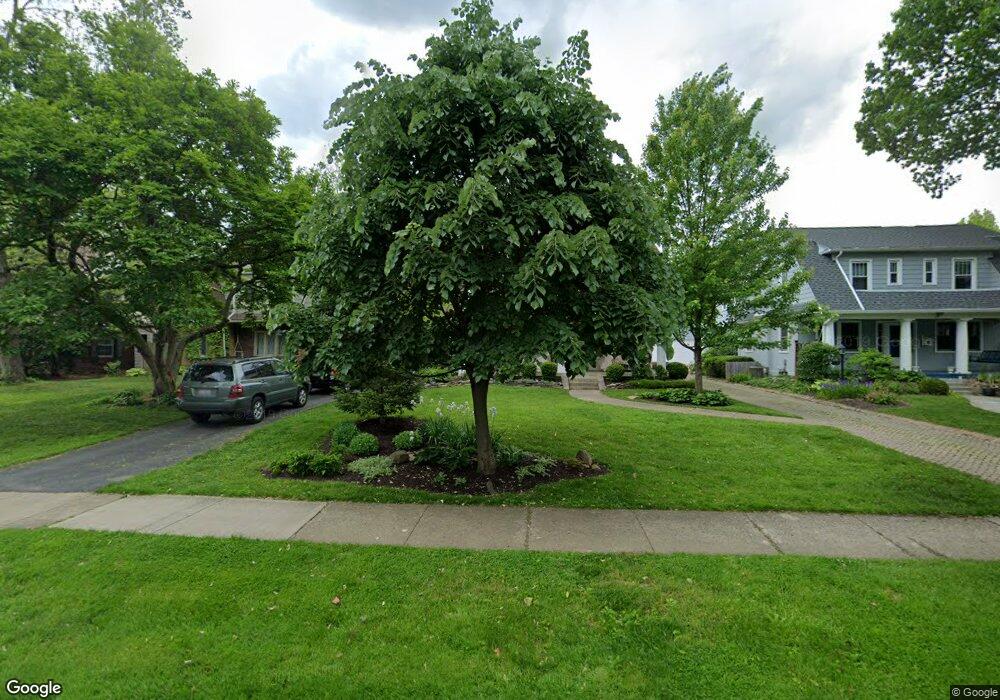
115 N Cassingham Rd Columbus, OH 43209
Estimated Value: $602,000 - $664,000
4
Beds
2
Baths
2,062
Sq Ft
$308/Sq Ft
Est. Value
About This Home
This home is located at 115 N Cassingham Rd, Columbus, OH 43209 and is currently estimated at $635,511, approximately $308 per square foot. 115 N Cassingham Rd is a home located in Franklin County with nearby schools including Maryland Elementary School, Bexley Middle School, and Bexley High School.
Ownership History
Date
Name
Owned For
Owner Type
Purchase Details
Closed on
Aug 28, 2014
Sold by
Keiffer Kristina and Keiffer Paul E
Bought by
Mannon Justin M and Mannon Cara
Current Estimated Value
Home Financials for this Owner
Home Financials are based on the most recent Mortgage that was taken out on this home.
Original Mortgage
$283,500
Outstanding Balance
$211,621
Interest Rate
4.1%
Mortgage Type
New Conventional
Estimated Equity
$423,890
Purchase Details
Closed on
May 26, 2010
Sold by
Kearns David K and Estatt Of Ula Jean Kearns
Bought by
Keiffer Kristina and Keiffer Paul E
Home Financials for this Owner
Home Financials are based on the most recent Mortgage that was taken out on this home.
Original Mortgage
$222,010
Interest Rate
5.5%
Mortgage Type
FHA
Purchase Details
Closed on
Jun 22, 1999
Sold by
Estate Of John T Kearns
Bought by
Kearns Ula J
Purchase Details
Closed on
Dec 24, 1963
Bought by
Kearns John T and Kearns Ula J
Create a Home Valuation Report for This Property
The Home Valuation Report is an in-depth analysis detailing your home's value as well as a comparison with similar homes in the area
Home Values in the Area
Average Home Value in this Area
Purchase History
We collect this data history from publicly available records. To have your information removed, we recommend requesting removal directly through your county’s website.
| Date | Buyer | Sale Price | Title Company |
|---|---|---|---|
| Mannon Justin M | $315,000 | None Available | |
| Keiffer Kristina | $228,000 | Valmer Land | |
| Kearns Ula J | -- | -- | |
| Kearns John T | -- | -- |
Source: Public Records
Mortgage History
We collect this data history from publicly available records. To have your information removed, we recommend requesting removal directly through your county’s website.
| Date | Status | Borrower | Loan Amount |
|---|---|---|---|
| Open | Mannon Justin M | $283,500 | |
| Closed | Keiffer Kristina | $222,010 |
Source: Public Records
Tax History
| Year | Tax Paid | Tax Assessment Tax Assessment Total Assessment is a certain percentage of the fair market value that is determined by local assessors to be the total taxable value of land and additions on the property. | Land | Improvement |
|---|---|---|---|---|
| 2025 | $9,322 | $167,860 | $61,740 | $106,120 |
| 2024 | $9,322 | $167,860 | $61,740 | $106,120 |
| 2023 | $8,381 | $167,860 | $61,740 | $106,120 |
| 2022 | $8,625 | $138,740 | $42,910 | $95,830 |
| 2021 | $8,632 | $138,740 | $42,910 | $95,830 |
| 2020 | $8,556 | $138,740 | $42,910 | $95,830 |
| 2019 | $8,115 | $115,780 | $35,770 | $80,010 |
| 2018 | $6,128 | $115,780 | $35,770 | $80,010 |
| 2017 | $6,882 | $115,780 | $35,770 | $80,010 |
| 2016 | $5,191 | $79,800 | $24,780 | $55,020 |
| 2015 | $5,206 | $79,800 | $24,780 | $55,020 |
| 2014 | $5,235 | $79,800 | $24,780 | $55,020 |
| 2013 | $2,721 | $79,800 | $24,780 | $55,020 |
Source: Public Records
Map
Nearby Homes
- 132 N Cassady Ave
- 41 N Ardmore Rd
- 178 N Remington Rd
- 108 N Stanwood Rd
- 238 N Cassady Ave
- 2629 E Broad St
- 36 Ashbourne Rd
- 259 N Remington Rd
- 2808 E Broad St
- 275 Ashbourne Place
- 193 Stanbery Ave
- 2465 E Broad St
- 30 S Dawson Ave
- 125 S Stanwood Rd
- 300 N Drexel Ave
- 140 S Cassingham Rd
- 112 S Cassady Ave
- 291 N Drexel Ave
- 205 N Gould Rd
- 381 Northview Dr
- 115 N Cassingham Rd
- 119 N Cassingham Rd
- 105 N Cassingham Rd
- 125 N Cassingham Rd
- 99 N Cassingham Rd
- 0 N Cassingham Rd
- 131 N Cassingham Rd
- 124 N Ardmore Rd
- 112 N Ardmore Rd
- 130 N Ardmore Rd
- 106 N Ardmore Rd
- 89 N Cassingham Rd
- 89 N Cassingham Rd
- 137 N Cassingham Rd
- 98 N Ardmore Rd
- 136 N Ardmore Rd
- 108 N Cassingham Rd
- 108 N Cassingham Rd
- 114 N Cassingham Rd
- 114 N Cassingham Rd
Your Personal Tour Guide
Ask me questions while you tour the home.