Studio
--
Bath
15,918
Sq Ft
37,897
Sq Ft Lot
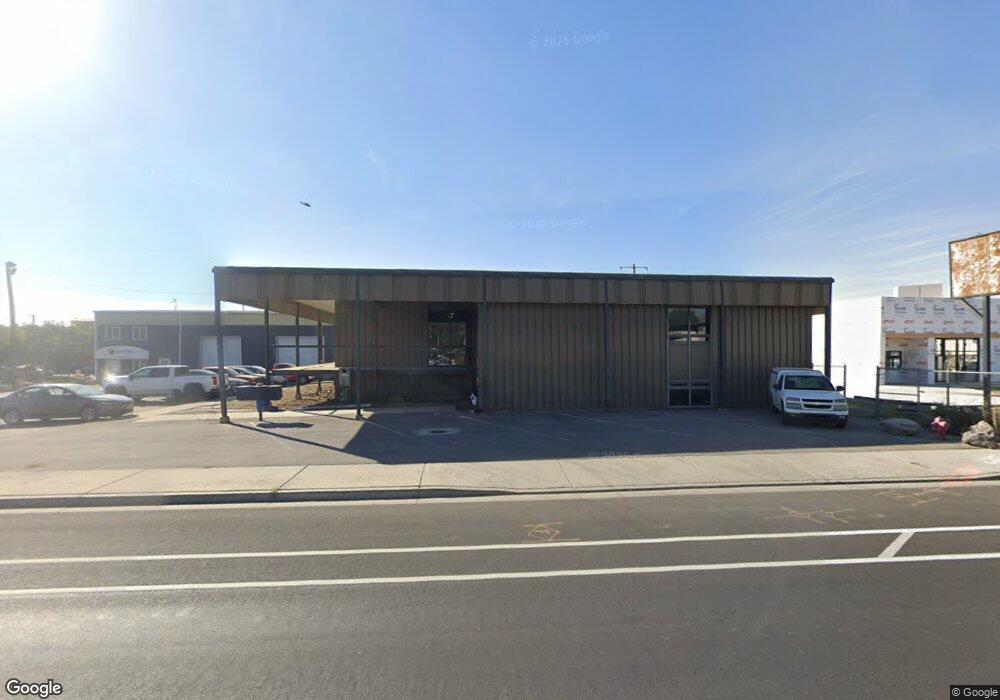
About This Home
This home is located at 115 N Geneva Rd, Orem, UT 84057. 115 N Geneva Rd is a home located in Utah County with nearby schools including Orem Junior High School, Mountain View High School, and Franklin Discovery Academy.
Ownership History
Date
Name
Owned For
Owner Type
Purchase Details
Closed on
Sep 5, 2024
Sold by
Rw Investments Llc
Bought by
Hd Vineyard Llc
Purchase Details
Closed on
Apr 4, 2012
Sold by
Sargent Mark and Sargent Debbie
Bought by
Taylor M Ray
Home Financials for this Owner
Home Financials are based on the most recent Mortgage that was taken out on this home.
Original Mortgage
$43,200
Interest Rate
3.91%
Mortgage Type
Commercial
Purchase Details
Closed on
Mar 7, 2011
Sold by
Clayson Rebecca Kirkham and Clayson Kreg
Bought by
Jam Investments Llc
Create a Home Valuation Report for This Property
The Home Valuation Report is an in-depth analysis detailing your home's value as well as a comparison with similar homes in the area
Home Values in the Area
Average Home Value in this Area
Purchase History
| Date | Buyer | Sale Price | Title Company |
|---|---|---|---|
| Hd Vineyard Llc | -- | Prospect Title | |
| Taylor M Ray | -- | None Available | |
| Jam Investments Llc | -- | Inwest Title |
Source: Public Records
Mortgage History
| Date | Status | Borrower | Loan Amount |
|---|---|---|---|
| Previous Owner | Taylor M Ray | $43,200 |
Source: Public Records
Tax History
| Year | Tax Paid | Tax Assessment Tax Assessment Total Assessment is a certain percentage of the fair market value that is determined by local assessors to be the total taxable value of land and additions on the property. | Land | Improvement |
|---|---|---|---|---|
| 2025 | $18,125 | $2,307,900 | $646,300 | $1,661,600 |
| 2024 | $18,125 | $1,700,300 | $0 | $0 |
| 2023 | $15,112 | $1,583,900 | $0 | $0 |
| 2022 | $14,470 | $1,474,400 | $511,700 | $962,700 |
| 2021 | $13,828 | $1,188,000 | $438,300 | $749,700 |
| 2020 | $14,187 | $1,188,000 | $438,300 | $749,700 |
| 2019 | $11,996 | $1,060,900 | $274,900 | $786,000 |
| 2018 | $11,608 | $943,700 | $229,200 | $714,500 |
| 2017 | $11,602 | $924,400 | $0 | $0 |
| 2016 | $10,958 | $868,800 | $0 | $0 |
| 2015 | $10,740 | $855,200 | $0 | $0 |
| 2014 | $10,463 | $838,200 | $0 | $0 |
Source: Public Records
Map
Nearby Homes
- 206 N 750 E
- 280 N 750 E
- 56 N Rue de Matth
- 266 N 725 E
- 266 N 590 E Unit Building 6
- 266 N 590 E Unit 6
- 624 E 300 N Unit 3
- 78 N Scarlet Maple Dr Unit 4304
- 341 N 680 E
- 283 N 590 E
- 212 N 590 E
- 235 N 590 E
- 1225 W 160 N
- 422 E 360 North St
- 1110 W 105 N
- 222 N 1200 W Unit 144
- 222 N 1200 W Unit 84
- 155 S 1200 W Unit 69
- 155 S 1200 W Unit 6
- 155 S 1200 W Unit 97
Your Personal Tour Guide
Ask me questions while you tour the home.