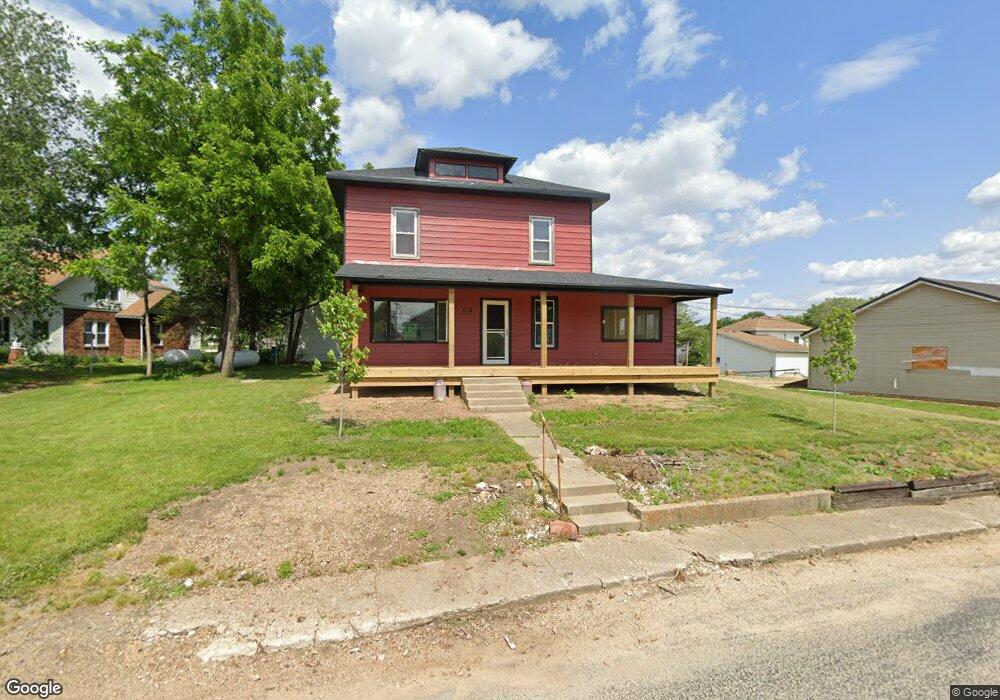
115 N Hulbert Rd Mc Connell, IL 61050
Estimated Value: $82,245 - $115,000
3
Beds
1
Bath
2,200
Sq Ft
$47/Sq Ft
Est. Value
About This Home
This home is located at 115 N Hulbert Rd, Mc Connell, IL 61050 and is currently estimated at $102,311, approximately $46 per square foot. 115 N Hulbert Rd is a home located in Stephenson County with nearby schools including Lena-Winslow Elementary School, Lena-Winslow Junior High School, and Lena-Winslow High School.
Create a Home Valuation Report for This Property
The Home Valuation Report is an in-depth analysis detailing your home's value as well as a comparison with similar homes in the area
Tax History
| Year | Tax Paid | Tax Assessment Tax Assessment Total Assessment is a certain percentage of the fair market value that is determined by local assessors to be the total taxable value of land and additions on the property. | Land | Improvement |
|---|---|---|---|---|
| 2024 | $1,885 | $21,015 | $1,214 | $19,801 |
| 2023 | $1,878 | $20,783 | $1,201 | $19,582 |
| 2022 | $1,451 | $16,117 | $1,201 | $14,916 |
| 2021 | $1,785 | $19,203 | $1,165 | $18,038 |
| 2020 | $1,773 | $19,203 | $1,165 | $18,038 |
| 2019 | $1,754 | $18,826 | $1,142 | $17,684 |
| 2018 | $1,727 | $18,322 | $1,111 | $17,211 |
| 2017 | $1,796 | $18,860 | $1,111 | $17,749 |
| 2016 | $1,783 | $18,860 | $1,111 | $17,749 |
| 2015 | $1,788 | $18,673 | $1,100 | $17,573 |
| 2013 | $1,362 | $20,025 | $1,065 | $18,960 |
Source: Public Records
Map
Nearby Homes
- TBD W Mcconnell Rd
- TBD N Flansburg Rd
- 000 W Beaver Rd
- 0 N Bellview Rd Unit 202507343
- 2472 W Red Oak Rd
- TBD Illinois Route 26
- 201 S Church St
- 514 Wolf Hollow Dr
- 510 Wolf Hollow Dr
- 515 Wolf Hollow Dr Unit or 415 Oak Ridge Dr
- 411 Oak Ridge Dr
- 506 Wolf Hollow Dr
- 9623 Deerfield Ln
- 416 Oak Ridge Dr Unit or 509 Wolf Hollow D
- 403 Oak Ridge Dr
- 215 Oak Terrace Ct Unit or 326 Valley View D
- 505 Wolf Hollow Dr
- 9717 Deerfield Ln
- 9648 W Royal Oaks Ct
- 213 Oak Terrace Ct
Your Personal Tour Guide
Ask me questions while you tour the home.