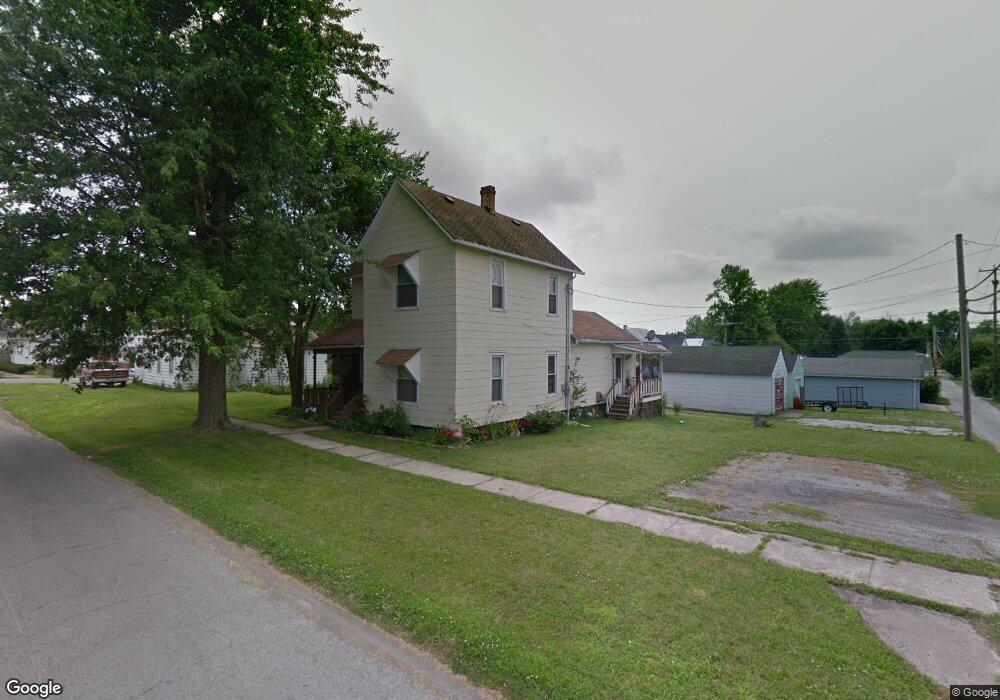
115 N Leighton St Kenton, OH 43326
Estimated Value: $78,087 - $167,000
3
Beds
2
Baths
1,868
Sq Ft
$63/Sq Ft
Est. Value
About This Home
This home is located at 115 N Leighton St, Kenton, OH 43326 and is currently estimated at $118,522, approximately $63 per square foot. 115 N Leighton St is a home located in Hardin County with nearby schools including Kenton Elementary School, Kenton Middle School, and Kenton High School.
Ownership History
Date
Name
Owned For
Owner Type
Purchase Details
Closed on
May 13, 2022
Sold by
Carrino Christina J
Bought by
Osborn Aaron
Current Estimated Value
Purchase Details
Closed on
Jul 23, 2007
Sold by
Aegis Mortgage Corp
Bought by
Carrino Christina J
Home Financials for this Owner
Home Financials are based on the most recent Mortgage that was taken out on this home.
Original Mortgage
$46,000
Interest Rate
6.69%
Mortgage Type
Unknown
Purchase Details
Closed on
Jun 30, 2005
Sold by
Wren Billy L
Bought by
Hewett Jarod A and Hewett Amanda R
Home Financials for this Owner
Home Financials are based on the most recent Mortgage that was taken out on this home.
Original Mortgage
$80,000
Interest Rate
8.56%
Mortgage Type
Adjustable Rate Mortgage/ARM
Purchase Details
Closed on
Oct 8, 2004
Bought by
Wren Billy L
Purchase Details
Closed on
Jul 6, 2004
Bought by
U S Bank Trustee
Purchase Details
Closed on
Aug 16, 1994
Bought by
Vanbuskirk Mark E and Vanbuskirk Lori
Create a Home Valuation Report for This Property
The Home Valuation Report is an in-depth analysis detailing your home's value as well as a comparison with similar homes in the area
Home Values in the Area
Average Home Value in this Area
Purchase History
| Date | Buyer | Sale Price | Title Company |
|---|---|---|---|
| Osborn Aaron | $39,500 | Seeley Thomas W | |
| Carrino Christina J | $46,000 | None Available | |
| Hewett Jarod A | $100,000 | -- | |
| Wren Billy L | $20,000 | -- | |
| U S Bank Trustee | $27,000 | -- | |
| Vanbuskirk Mark E | $26,500 | -- |
Source: Public Records
Mortgage History
| Date | Status | Borrower | Loan Amount |
|---|---|---|---|
| Previous Owner | Carrino Christina J | $46,000 | |
| Previous Owner | Hewett Jarod A | $80,000 |
Source: Public Records
Tax History Compared to Growth
Tax History
| Year | Tax Paid | Tax Assessment Tax Assessment Total Assessment is a certain percentage of the fair market value that is determined by local assessors to be the total taxable value of land and additions on the property. | Land | Improvement |
|---|---|---|---|---|
| 2024 | $1,148 | $25,360 | $2,490 | $22,870 |
| 2023 | $1,148 | $25,360 | $2,490 | $22,870 |
| 2022 | $899 | $17,480 | $1,740 | $15,740 |
| 2021 | $841 | $17,480 | $1,740 | $15,740 |
| 2020 | $834 | $17,480 | $1,740 | $15,740 |
| 2019 | $728 | $14,510 | $1,660 | $12,850 |
| 2018 | $704 | $14,510 | $1,660 | $12,850 |
| 2017 | $696 | $14,510 | $1,660 | $12,850 |
| 2016 | $828 | $18,760 | $1,970 | $16,790 |
| 2015 | $694 | $18,760 | $1,970 | $16,790 |
| 2014 | $1,206 | $18,760 | $1,970 | $16,790 |
| 2013 | $896 | $20,160 | $1,970 | $18,190 |
Source: Public Records
Map
Nearby Homes
- 362 W Columbus St
- 458 W Columbus St
- 0 Ohio 309
- 702 W Franklin St Unit 702 1/2
- 723 W Lima St Unit 1
- 328 N Detroit St
- 233 N Main St
- 745 W Franklin St
- 726 Tracy St
- 368 N Ida St
- 120 E Ohio St
- 406 Terry St
- 324 E North St
- 121 S High St
- 416 N Cherry St
- 407 Smith Ave
- 137 E Espy St
- 602 N Wayne St
- 700 N Ida St
- 506 E Franklin St
- 121 N Leighton St
- 404 W Columbus St
- 408 W Columbus St
- 412 W Columbus St
- 366 W Columbus St
- 124 N Leighton St
- 125 N Leighton St
- 414 W Columbus St
- 418 W Columbus St
- 401 W Columbus St
- 130 N Leighton St
- 411 W Columbus St Unit 411 1/2
- 129 N Leighton St
- 131 N Leighton St
- 413 W Columbus St
- 422 W Columbus St
- 363 W Carrol St
- 356 W Columbus St
- 428 W Columbus St
- 134 N Leighton St