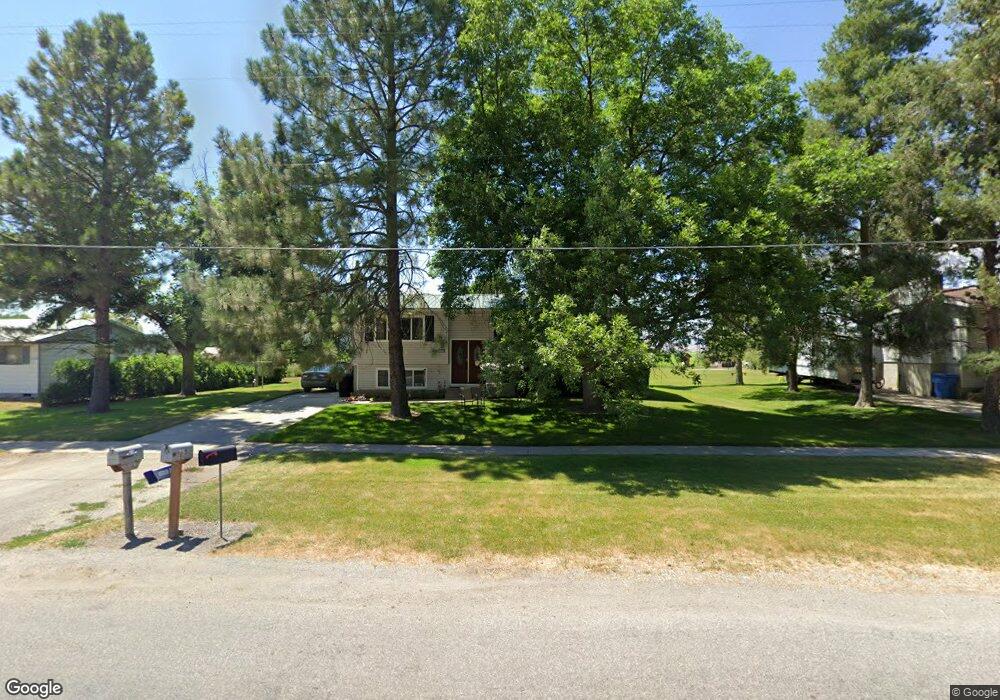
115 N Main St Lewiston, UT 84320
Estimated Value: $297,000 - $337,000
--
Bed
--
Bath
1,026
Sq Ft
$307/Sq Ft
Est. Value
About This Home
This home is located at 115 N Main St, Lewiston, UT 84320 and is currently estimated at $314,920, approximately $306 per square foot. 115 N Main St is a home with nearby schools including Lewiston School, White Pine Middle School, and North Cache Middle School.
Ownership History
Date
Name
Owned For
Owner Type
Purchase Details
Closed on
Jul 29, 2024
Sold by
Seamons Tammy
Bought by
Morlyn And Tammy Seamons Family Trust and Seamons
Current Estimated Value
Purchase Details
Closed on
Nov 19, 2012
Sold by
Seamons Morlyn S and Seamons Tammy W
Bought by
Seamons Morlyn and Seamons Tammy
Home Financials for this Owner
Home Financials are based on the most recent Mortgage that was taken out on this home.
Original Mortgage
$88,900
Interest Rate
3.35%
Mortgage Type
New Conventional
Create a Home Valuation Report for This Property
The Home Valuation Report is an in-depth analysis detailing your home's value as well as a comparison with similar homes in the area
Home Values in the Area
Average Home Value in this Area
Purchase History
| Date | Buyer | Sale Price | Title Company |
|---|---|---|---|
| Morlyn And Tammy Seamons Family Trust | -- | None Listed On Document | |
| Seamons Morlyn | -- | Northern Title Company |
Source: Public Records
Mortgage History
| Date | Status | Borrower | Loan Amount |
|---|---|---|---|
| Previous Owner | Seamons Morlyn | $88,900 |
Source: Public Records
Tax History Compared to Growth
Tax History
| Year | Tax Paid | Tax Assessment Tax Assessment Total Assessment is a certain percentage of the fair market value that is determined by local assessors to be the total taxable value of land and additions on the property. | Land | Improvement |
|---|---|---|---|---|
| 2025 | $1,480 | $191,315 | $0 | $0 |
| 2024 | $1,342 | $160,275 | $0 | $0 |
| 2023 | $1,424 | $159,730 | $0 | $0 |
| 2022 | $1,496 | $159,730 | $0 | $0 |
| 2021 | $1,422 | $234,800 | $49,400 | $185,400 |
| 2020 | $1,206 | $190,140 | $35,640 | $154,500 |
| 2019 | $1,049 | $158,020 | $35,640 | $122,380 |
| 2018 | $946 | $139,352 | $35,640 | $103,712 |
| 2017 | $902 | $70,530 | $0 | $0 |
| 2016 | $911 | $70,530 | $0 | $0 |
| 2015 | $902 | $69,980 | $0 | $0 |
| 2014 | $797 | $63,375 | $0 | $0 |
| 2013 | -- | $63,375 | $0 | $0 |
Source: Public Records
Map
Nearby Homes
- 50 W 300 S
- 80 W 300 S
- 930 S 800 E
- 12506 N 525 E Unit 6
- 12489 N 525 E
- 12455 N 525 E Unit 1
- 12455 N 525 E
- 12506 N 525 E
- 12484 N 525 E Unit 7
- 12521 N 525 E
- 12518 N 525 E Unit 5
- 12489 N 525 E Unit 2
- 2400 W
- 12484 N 525 E
- 12518 N 525 E
- 12456 N 525 E Unit 8
- 12521 N 525 E Unit 3
- 12456 N 525 E
- 545 N 1600 W
- 435 E 1600 S Unit EAST