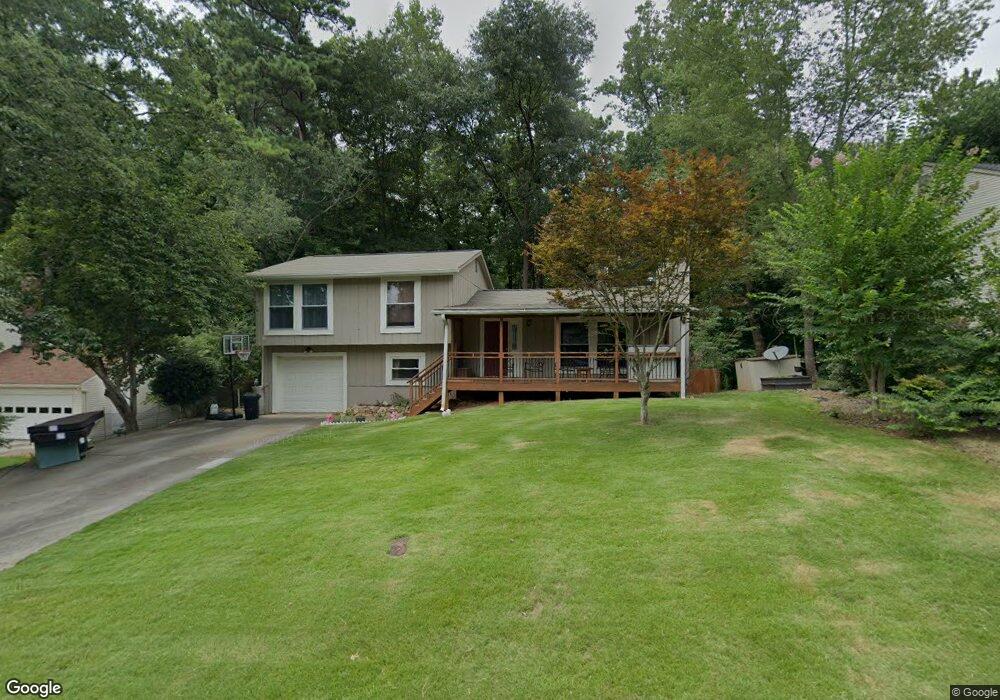
115 North Pond Way Unit 1 Roswell, GA 30076
Martin's Landing NeighborhoodEstimated Value: $426,000 - $443,000
3
Beds
2
Baths
1,248
Sq Ft
$348/Sq Ft
Est. Value
About This Home
This home is located at 115 North Pond Way Unit 1, Roswell, GA 30076 and is currently estimated at $434,046, approximately $347 per square foot. 115 North Pond Way Unit 1 is a home located in Fulton County with nearby schools including Jackson Elementary School, Holcomb Bridge Middle School, and Centennial High School.
Ownership History
Date
Name
Owned For
Owner Type
Purchase Details
Closed on
Dec 9, 2022
Sold by
Brunson Dorsey
Bought by
Bilotta Valerie Ann and Carley Benjamin B
Current Estimated Value
Purchase Details
Closed on
Dec 30, 2010
Sold by
Fox Jennifer N
Bought by
Brunson Dorsey
Home Financials for this Owner
Home Financials are based on the most recent Mortgage that was taken out on this home.
Original Mortgage
$145,222
Interest Rate
4.37%
Mortgage Type
FHA
Purchase Details
Closed on
Apr 30, 1993
Sold by
Altena Jane
Bought by
Kuehl Christopher K
Home Financials for this Owner
Home Financials are based on the most recent Mortgage that was taken out on this home.
Original Mortgage
$97,850
Interest Rate
7.39%
Create a Home Valuation Report for This Property
The Home Valuation Report is an in-depth analysis detailing your home's value as well as a comparison with similar homes in the area
Home Values in the Area
Average Home Value in this Area
Purchase History
| Date | Buyer | Sale Price | Title Company |
|---|---|---|---|
| Bilotta Valerie Ann | $345,000 | -- | |
| Brunson Dorsey | $149,000 | -- | |
| Kuehl Christopher K | $103,000 | -- |
Source: Public Records
Mortgage History
| Date | Status | Borrower | Loan Amount |
|---|---|---|---|
| Previous Owner | Brunson Dorsey | $145,222 | |
| Previous Owner | Kuehl Christopher K | $97,850 |
Source: Public Records
Tax History Compared to Growth
Tax History
| Year | Tax Paid | Tax Assessment Tax Assessment Total Assessment is a certain percentage of the fair market value that is determined by local assessors to be the total taxable value of land and additions on the property. | Land | Improvement |
|---|---|---|---|---|
| 2025 | $670 | $147,960 | $48,080 | $99,880 |
| 2023 | $3,895 | $138,000 | $41,600 | $96,400 |
| 2022 | $3,363 | $127,840 | $34,000 | $93,840 |
| 2021 | $3,570 | $112,080 | $22,760 | $89,320 |
| 2020 | $3,411 | $104,160 | $28,880 | $75,280 |
| 2019 | $507 | $102,280 | $28,360 | $73,920 |
| 2018 | $2,483 | $87,960 | $18,960 | $69,000 |
| 2017 | $1,956 | $67,040 | $17,960 | $49,080 |
| 2016 | $1,956 | $67,040 | $17,960 | $49,080 |
| 2015 | $2,330 | $67,040 | $17,960 | $49,080 |
| 2014 | $1,702 | $55,520 | $12,360 | $43,160 |
Source: Public Records
Map
Nearby Homes
- 125 N Pond Way
- 150 N Pond Ct Unit 1
- 324 Teal Ct
- 406 Teal Ct
- 645 Trailmore Place
- 227 Quail Run
- 225 Winterberry Ct
- 230 Winterberry Ct
- 309 Quail Run
- 311 Quail Run
- 315 Sea Holly Cir
- 130 Lakeview Ridge W
- 263 Quail Run
- 230 Lakeview Ridge E
- 9470 Hillside Dr
- 1050 Terramont Dr
- 420 Little Pines Ct
- 2240 Six Branches Dr
- 1220 Terramont Dr
- 1265 Northshore Dr
- 115 N Pond Way
- 125 North Pond Way Unit 1
- 105 North Pond Way
- N N Pond Way
- 9682 N Pond Cir
- 135 North Pond Way
- 120 N Pond Way
- 120 North Pond Way
- 130 North Pond Way
- 130 N Pond Way
- 110 North Pond Way Unit 1
- 110 N Pond Way Unit 110
- 110 N Pond Way
- 500 Sailwind Dr
- 9675 N Pond Cir
- 145 N Pond Way
- 9665 N Pond Cir
- 100 North Pond Way Unit 1
- 145 North Pond Way Unit 1
- 140 North Pond Way