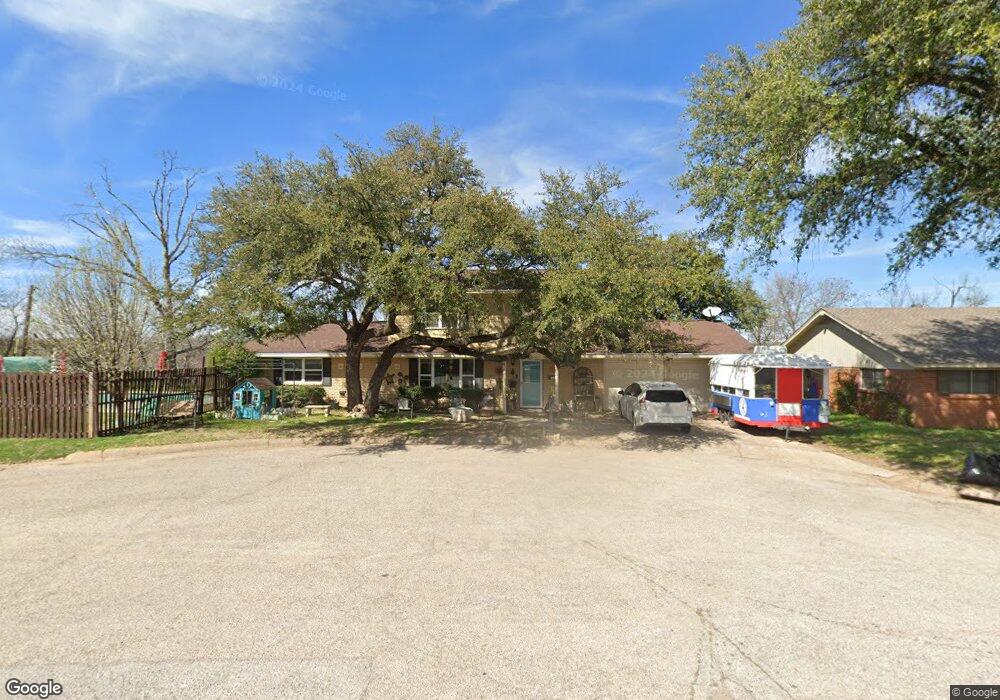
115 Oak Ridge Terrace Weatherford, TX 76086
Estimated Value: $352,000 - $382,000
3
Beds
2
Baths
2,052
Sq Ft
$177/Sq Ft
Est. Value
About This Home
This home is located at 115 Oak Ridge Terrace, Weatherford, TX 76086 and is currently estimated at $362,786, approximately $176 per square foot. 115 Oak Ridge Terrace is a home located in Parker County with nearby schools including Curtis Elementary School, Hall Middle School, and Weatherford High School.
Ownership History
Date
Name
Owned For
Owner Type
Purchase Details
Closed on
Jan 14, 2022
Sold by
Mendolia Dorothy J
Bought by
Atkins Angela L and Atkins Rick A
Current Estimated Value
Home Financials for this Owner
Home Financials are based on the most recent Mortgage that was taken out on this home.
Original Mortgage
$200,000
Outstanding Balance
$184,589
Interest Rate
3.22%
Mortgage Type
Credit Line Revolving
Estimated Equity
$178,197
Purchase Details
Closed on
Oct 20, 2011
Sold by
Hales Michael V and Hales Christa
Bought by
Atkins Angela L and Hales Rick A
Home Financials for this Owner
Home Financials are based on the most recent Mortgage that was taken out on this home.
Original Mortgage
$121,831
Interest Rate
4.17%
Mortgage Type
FHA
Purchase Details
Closed on
Feb 8, 1991
Bought by
Atkins Angela L
Create a Home Valuation Report for This Property
The Home Valuation Report is an in-depth analysis detailing your home's value as well as a comparison with similar homes in the area
Home Values in the Area
Average Home Value in this Area
Purchase History
| Date | Buyer | Sale Price | Title Company |
|---|---|---|---|
| Atkins Angela L | -- | Fidelity National Title | |
| Atkins Angela L | -- | Nat | |
| Atkins Angela L | -- | -- |
Source: Public Records
Mortgage History
| Date | Status | Borrower | Loan Amount |
|---|---|---|---|
| Open | Atkins Angela L | $200,000 | |
| Previous Owner | Atkins Angela L | $121,831 |
Source: Public Records
Tax History Compared to Growth
Tax History
| Year | Tax Paid | Tax Assessment Tax Assessment Total Assessment is a certain percentage of the fair market value that is determined by local assessors to be the total taxable value of land and additions on the property. | Land | Improvement |
|---|---|---|---|---|
| 2025 | $3,990 | $330,947 | -- | -- |
| 2024 | $3,990 | $300,861 | -- | -- |
| 2023 | $3,990 | $273,510 | $0 | $0 |
| 2022 | $5,515 | $257,150 | $25,000 | $232,150 |
| 2021 | $5,429 | $257,150 | $25,000 | $232,150 |
| 2020 | $4,526 | $198,230 | $25,000 | $173,230 |
| 2019 | $4,349 | $198,230 | $25,000 | $173,230 |
| 2018 | $3,971 | $159,260 | $25,000 | $134,260 |
| 2017 | $3,703 | $159,260 | $25,000 | $134,260 |
| 2016 | $3,366 | $127,940 | $25,000 | $102,940 |
| 2015 | $2,927 | $127,940 | $25,000 | $102,940 |
| 2014 | $2,858 | $122,130 | $25,000 | $97,130 |
Source: Public Records
Map
Nearby Homes
- 423 Live Oak Ln
- 209 S Hill Dr
- 102 Bob White Ave
- 1213 S Lamar St
- 1220 S Brazos St
- 323 W Rentz St
- 918 El Dorado St
- 905 Eldorado St
- 208 W Park Ave
- 1009 S Brazos St
- 905 S Lamar St
- 122 Rachel Rd
- 904 S Brazos St
- 1816 Barberry
- 819 Norton St
- 741 Nandina Rd
- 1813 Barberry Way
- 824 S Alamo St
- 902 S Waco St
- 213 Jefferson St
- 101 Oak Ridge Terrace
- 103 Oak Ridge Terrace
- 108 W Ridge Rd
- 111 W Ridge St
- 137 W Ridge St
- 104 Oak Ridge Terrace
- 201 W Ridge Rd
- 105 W Ridge St
- 105 Oak Ridge Terrace
- 105 W Ridge Rd
- 106 Oak Ridge Terrace
- 104 W Ridge Rd
- 103 W Ridge Rd
- 107 Oak Ridge Terrace
- 205 W Ridge Rd
- 108 Oak Ridge Terrace
- TBD Live Oak Ln
- TBD 15 Live Oak Ln
- 205 S Hill Dr
- 405 Live Oak Ln