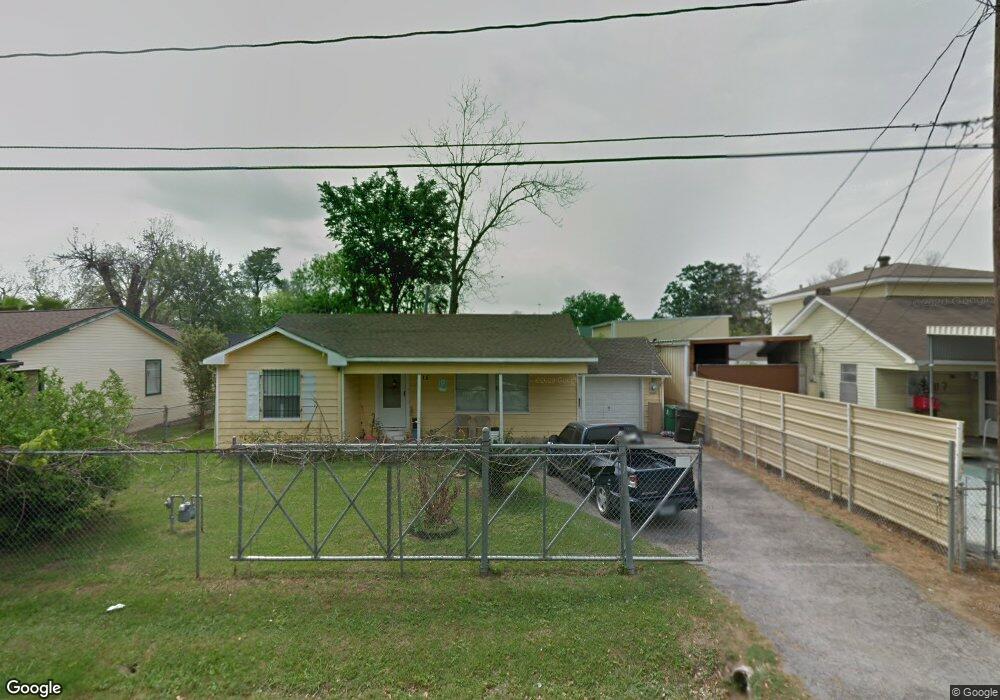
115 Oddo St Houston, TX 77022
Northside-Northline NeighborhoodEstimated Value: $203,000 - $285,000
3
Beds
1
Bath
1,614
Sq Ft
$145/Sq Ft
Est. Value
About This Home
This home is located at 115 Oddo St, Houston, TX 77022 and is currently estimated at $234,834, approximately $145 per square foot. 115 Oddo St is a home located in Harris County with nearby schools including Herrera Elementary School, Burbank Middle School, and Sam Houston Math, Science & Technology Center.
Ownership History
Date
Name
Owned For
Owner Type
Purchase Details
Closed on
Jun 11, 2004
Sold by
Barron Marcos and Barron Martha
Bought by
Garcia Lucino and Susano Reina
Current Estimated Value
Home Financials for this Owner
Home Financials are based on the most recent Mortgage that was taken out on this home.
Original Mortgage
$80,729
Outstanding Balance
$39,781
Interest Rate
6.12%
Mortgage Type
Purchase Money Mortgage
Estimated Equity
$195,053
Purchase Details
Closed on
Dec 23, 1996
Sold by
Houston Housing Finance Corp
Bought by
Barron Marcos and Barron Martha
Create a Home Valuation Report for This Property
The Home Valuation Report is an in-depth analysis detailing your home's value as well as a comparison with similar homes in the area
Home Values in the Area
Average Home Value in this Area
Purchase History
| Date | Buyer | Sale Price | Title Company |
|---|---|---|---|
| Garcia Lucino | -- | -- | |
| Barron Marcos | -- | -- |
Source: Public Records
Mortgage History
| Date | Status | Borrower | Loan Amount |
|---|---|---|---|
| Open | Garcia Lucino | $80,729 |
Source: Public Records
Tax History
| Year | Tax Paid | Tax Assessment Tax Assessment Total Assessment is a certain percentage of the fair market value that is determined by local assessors to be the total taxable value of land and additions on the property. | Land | Improvement |
|---|---|---|---|---|
| 2025 | $2,500 | $237,372 | $93,500 | $143,872 |
| 2024 | $2,500 | $225,161 | $93,500 | $131,661 |
| 2023 | $2,500 | $237,209 | $81,125 | $156,084 |
| 2022 | $3,656 | $197,320 | $60,500 | $136,820 |
| 2021 | $3,518 | $167,530 | $60,500 | $107,030 |
| 2020 | $3,323 | $153,675 | $60,500 | $93,175 |
| 2019 | $3,156 | $144,881 | $49,500 | $95,381 |
| 2018 | $2,005 | $113,393 | $34,375 | $79,018 |
| 2017 | $2,867 | $113,393 | $34,375 | $79,018 |
| 2016 | $2,867 | $113,393 | $34,375 | $79,018 |
| 2015 | $1,870 | $111,688 | $27,500 | $84,188 |
| 2014 | $1,870 | $107,725 | $19,250 | $88,475 |
Source: Public Records
Map
Nearby Homes
- 120 Westfield St
- 206 Oddo St
- 105 Oddo St
- 64 Neyland St
- 104 Foyce St
- 136 Theron St
- 164 Wallace St
- 1315 Neyland St
- 0 E 31st St Unit 75519178
- 0 W Hardy St Unit 97848877
- 0 W Hardy St Unit 80694202
- 3111 Eastman St
- 7111 Bauman Rd
- 249 Basswood St
- 0 Yorkshire St Unit 22534906
- 1224 Johnston St
- 1228 Johnston St
- 7820 Fulton St
- 1222 Johnston St
- 1224 Neyland St
Your Personal Tour Guide
Ask me questions while you tour the home.