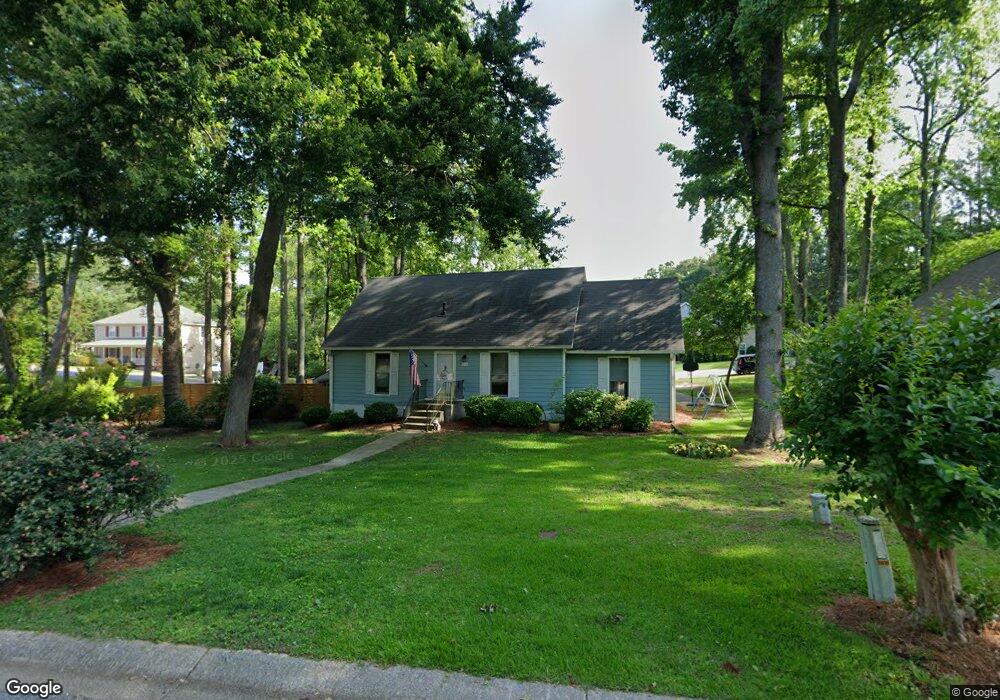
115 Orchard St Carrollton, GA 30117
Estimated Value: $250,000 - $262,000
2
Beds
2
Baths
1,708
Sq Ft
$151/Sq Ft
Est. Value
About This Home
This home is located at 115 Orchard St, Carrollton, GA 30117 and is currently estimated at $258,193, approximately $151 per square foot. 115 Orchard St is a home located in Carroll County with nearby schools including Carrollton Elementary School, Carrollton Upper Elementary School, and Carrollton Middle School.
Ownership History
Date
Name
Owned For
Owner Type
Purchase Details
Closed on
Feb 17, 2017
Sold by
Willis Judy
Bought by
Smith Gregory Shane and Smith Sandra Gail
Current Estimated Value
Home Financials for this Owner
Home Financials are based on the most recent Mortgage that was taken out on this home.
Original Mortgage
$96,445
Outstanding Balance
$79,964
Interest Rate
4.25%
Mortgage Type
FHA
Estimated Equity
$178,229
Purchase Details
Closed on
Jun 5, 2003
Sold by
Lane Greg and Lane Amy
Bought by
Willis Judy
Purchase Details
Closed on
Jun 30, 2000
Sold by
Lane Greg
Bought by
Lane Greg and Lane Amy
Purchase Details
Closed on
Feb 23, 1999
Sold by
Lane Merritt
Bought by
Lane Greg
Purchase Details
Closed on
Oct 2, 1998
Sold by
Chappell Hazel
Bought by
Lane Merritt
Purchase Details
Closed on
Jul 10, 1996
Sold by
Chappell
Bought by
Chappell Hazel
Purchase Details
Closed on
Jul 28, 1992
Sold by
Costley
Bought by
Chappell
Create a Home Valuation Report for This Property
The Home Valuation Report is an in-depth analysis detailing your home's value as well as a comparison with similar homes in the area
Home Values in the Area
Average Home Value in this Area
Purchase History
| Date | Buyer | Sale Price | Title Company |
|---|---|---|---|
| Smith Gregory Shane | $98,255 | -- | |
| Willis Judy | $112,000 | -- | |
| Lane Greg | -- | -- | |
| Lane Greg | $89,000 | -- | |
| Lane Merritt | $80,000 | -- | |
| Chappell Hazel | -- | -- | |
| Chappell | $4,300 | -- |
Source: Public Records
Mortgage History
| Date | Status | Borrower | Loan Amount |
|---|---|---|---|
| Open | Smith Gregory Shane | $96,445 |
Source: Public Records
Tax History Compared to Growth
Tax History
| Year | Tax Paid | Tax Assessment Tax Assessment Total Assessment is a certain percentage of the fair market value that is determined by local assessors to be the total taxable value of land and additions on the property. | Land | Improvement |
|---|---|---|---|---|
| 2024 | $2,186 | $80,014 | $7,500 | $72,514 |
| 2023 | $2,186 | $73,520 | $7,500 | $66,020 |
| 2022 | $1,763 | $60,395 | $7,500 | $52,895 |
| 2021 | $1,545 | $52,924 | $7,500 | $45,424 |
| 2020 | $1,390 | $47,572 | $7,500 | $40,072 |
| 2019 | $1,306 | $44,283 | $7,500 | $36,783 |
| 2018 | $1,176 | $45,912 | $7,500 | $38,412 |
| 2017 | $1,227 | $40,794 | $7,500 | $33,294 |
| 2016 | $1,049 | $40,794 | $7,500 | $33,294 |
| 2015 | $1,130 | $36,601 | $5,000 | $31,601 |
| 2014 | $1,135 | $36,601 | $5,000 | $31,601 |
Source: Public Records
Map
Nearby Homes
- 119 Oxford Square
- 201 Stewart St
- 114 Green Point Way
- 123 Autumn Glen Dr
- 120 Stewart St
- 122 Mandeville Ave
- 322 Cedar St
- 541 N White St Unit 12
- 541 N White St
- 325 Almon Rd
- 123 Cedar Park Way
- 777 College St
- 111 Lakeview Dr
- 103 W Chandler St
- 114 Bennett Cir
- 110 Town Walk Ln
- 0 Ward St Unit 10390499
- 205 Johnson Ave Unit 231
- 0 Burns Rd Unit LOT 2 10571612
- 0 Burns Rd Unit LOT 3 10571635
- 117 Orchard St
- 111 Orchard St
- 102 Oxford Square
- 0 Orchard St Unit 7581984
- 0 Orchard St Unit 7150695
- 0 Orchard St Unit 7040844
- 0 Orchard St Unit 3236364
- 0 Orchard St Unit 8705463
- 119 Orchard St
- 109 Orchard St
- 101 Deese Ct
- 104 Frankford Way
- 112 Oxford Square
- 100 Deese Ct
- 100 Deese Ct Unit 20
- 107 Orchard St
- 104 Oxford Square
- 104 Oxford Square
- 101 Oxford Square
- 101 Oxford Square