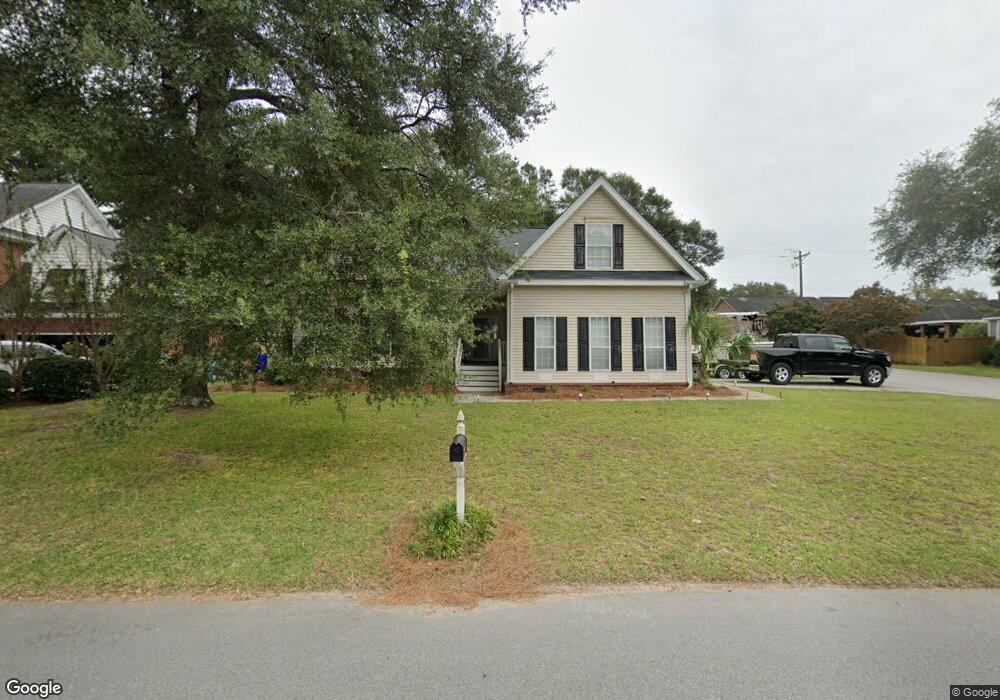
115 Oyster Point Row Charleston, SC 29412
James Island NeighborhoodEstimated Value: $619,603 - $778,000
4
Beds
2
Baths
1,960
Sq Ft
$353/Sq Ft
Est. Value
About This Home
This home is located at 115 Oyster Point Row, Charleston, SC 29412 and is currently estimated at $692,401, approximately $353 per square foot. 115 Oyster Point Row is a home located in Charleston County with nearby schools including Harbor View Elementary School, Camp Road Middle, and James Island Charter High School.
Ownership History
Date
Name
Owned For
Owner Type
Purchase Details
Closed on
Feb 24, 2014
Sold by
Snider George E
Bought by
Hodgkins Derick E and Hodgkins Whitney
Current Estimated Value
Home Financials for this Owner
Home Financials are based on the most recent Mortgage that was taken out on this home.
Original Mortgage
$284,075
Outstanding Balance
$215,341
Interest Rate
4.42%
Mortgage Type
VA
Estimated Equity
$477,060
Purchase Details
Closed on
Mar 29, 2007
Sold by
Snider George and Snider Richard
Bought by
Snider George E and Snider Richard D
Purchase Details
Closed on
Jun 17, 2005
Sold by
Snider George and Snider Richard
Bought by
Snider George and Snider Richard
Purchase Details
Closed on
Dec 21, 1999
Sold by
Snider Dean and Snider Doris
Bought by
Snider Dean and Snider Doris
Purchase Details
Closed on
Oct 8, 1999
Sold by
Southeastern Construction/Equipment Co I
Bought by
Snider Dean and Snider Doris
Create a Home Valuation Report for This Property
The Home Valuation Report is an in-depth analysis detailing your home's value as well as a comparison with similar homes in the area
Home Values in the Area
Average Home Value in this Area
Purchase History
| Date | Buyer | Sale Price | Title Company |
|---|---|---|---|
| Hodgkins Derick E | $275,000 | -- | |
| Snider George E | -- | Attorney | |
| Snider George | -- | -- | |
| Snider Dean | -- | -- | |
| Snider Dean | $179,900 | -- |
Source: Public Records
Mortgage History
| Date | Status | Borrower | Loan Amount |
|---|---|---|---|
| Open | Hodgkins Derick E | $284,075 |
Source: Public Records
Tax History Compared to Growth
Tax History
| Year | Tax Paid | Tax Assessment Tax Assessment Total Assessment is a certain percentage of the fair market value that is determined by local assessors to be the total taxable value of land and additions on the property. | Land | Improvement |
|---|---|---|---|---|
| 2024 | $1,711 | $12,650 | $0 | $0 |
| 2023 | $1,711 | $12,650 | $0 | $0 |
| 2022 | $1,581 | $12,650 | $0 | $0 |
| 2021 | $1,657 | $12,650 | $0 | $0 |
| 2020 | $1,717 | $12,650 | $0 | $0 |
| 2019 | $1,531 | $11,000 | $0 | $0 |
| 2017 | $1,478 | $11,000 | $0 | $0 |
| 2016 | $1,418 | $11,000 | $0 | $0 |
| 2015 | $4,044 | $16,500 | $0 | $0 |
| 2014 | $1,122 | $0 | $0 | $0 |
| 2011 | -- | $0 | $0 | $0 |
Source: Public Records
Map
Nearby Homes
- 50 Held Cir Unit C
- 9 Maplecrest Dr
- 14 Maplecrest Dr
- 1 Maplecrest Dr
- 36 Forde Row
- 35 Rivers Point Row Unit A
- 14 Clam Shell Row
- 10 Bass Ln Unit D
- 17 S Anderson Ave Unit A,B,C, D
- 1 S Anderson Ave
- 27 Brockman Dr Unit 27B
- 27 Brockman Dr Unit 27C
- 21 Rivers Point Row Unit 11 C
- 21 Rivers Point Row Unit 3C
- 1616 Relyea Ave
- 1453 Camp Rd
- 1563 Relyea Ave
- 1632 N Relyea Ave
- 1402 Camp Rd Unit 5E
- 1402 Camp Rd Unit 6E
- 117 Oyster Point Row
- 48 Held Cir
- 113 Oyster Point Row
- 46 Held Cir
- 119 Oyster Point Row
- 50 Held Cir Unit D
- 50 Held Cir Unit A
- 50 Held Cir Unit 50c
- 116 Oyster Point Row
- 118 Oyster Point Row
- 114 Oyster Point Row
- 111 Oyster Point Row
- 44 Held Cir
- 112 Oyster Point Row
- 121 Oyster Point Row
- 54 Held Cir Unit C
- 54 Held Cir Unit B
- 54 Held Cir Unit A
- 120 Oyster Point Row
- 42 Held Cir