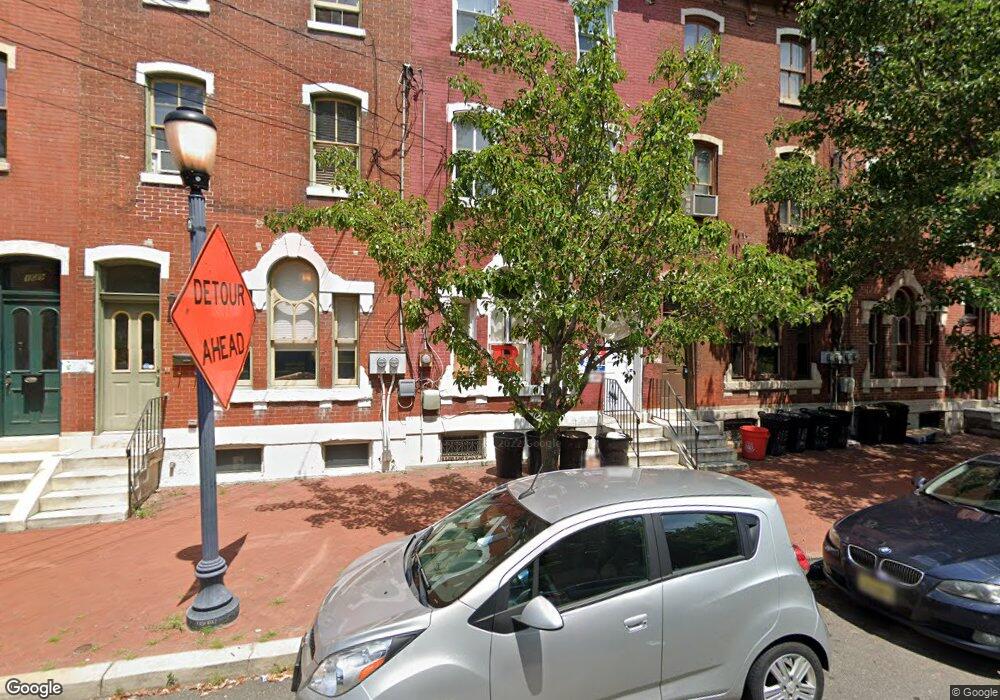
115 Penn St Camden, NJ 08102
Cooper Grant NeighborhoodEstimated Value: $304,302 - $404,000
--
Bed
--
Bath
1,800
Sq Ft
$191/Sq Ft
Est. Value
About This Home
This home is located at 115 Penn St, Camden, NJ 08102 and is currently estimated at $343,326, approximately $190 per square foot. 115 Penn St is a home located in Camden County with nearby schools including Eastside High School, Leap Academy University Charter School, and Hope Community Charter School.
Ownership History
Date
Name
Owned For
Owner Type
Purchase Details
Closed on
Jul 5, 2024
Sold by
Gillespie Judyann S and Mccarthy Donal E
Bought by
El Castello Properties Llc
Current Estimated Value
Home Financials for this Owner
Home Financials are based on the most recent Mortgage that was taken out on this home.
Original Mortgage
$195,000
Outstanding Balance
$192,612
Interest Rate
6.86%
Mortgage Type
New Conventional
Estimated Equity
$150,714
Purchase Details
Closed on
Mar 5, 2018
Sold by
Cbgjh Lc
Bought by
Wilcox Ida L
Home Financials for this Owner
Home Financials are based on the most recent Mortgage that was taken out on this home.
Original Mortgage
$122,100
Interest Rate
4.43%
Mortgage Type
New Conventional
Purchase Details
Closed on
Sep 6, 2002
Sold by
Noll Diana U
Bought by
Gillespie Judyann S
Home Financials for this Owner
Home Financials are based on the most recent Mortgage that was taken out on this home.
Original Mortgage
$142,325
Interest Rate
6.25%
Create a Home Valuation Report for This Property
The Home Valuation Report is an in-depth analysis detailing your home's value as well as a comparison with similar homes in the area
Home Values in the Area
Average Home Value in this Area
Purchase History
| Date | Buyer | Sale Price | Title Company |
|---|---|---|---|
| El Castello Properties Llc | $300,000 | Title Company Of Jersey | |
| Wilcox Ida L | $120,000 | Sjs Title Llc | |
| Gillespie Judyann S | $155,000 | -- |
Source: Public Records
Mortgage History
| Date | Status | Borrower | Loan Amount |
|---|---|---|---|
| Open | El Castello Properties Llc | $195,000 | |
| Previous Owner | Wilcox Ida L | $122,100 | |
| Previous Owner | Gillespie Judyann S | $142,325 |
Source: Public Records
Tax History Compared to Growth
Tax History
| Year | Tax Paid | Tax Assessment Tax Assessment Total Assessment is a certain percentage of the fair market value that is determined by local assessors to be the total taxable value of land and additions on the property. | Land | Improvement |
|---|---|---|---|---|
| 2025 | $4,450 | $125,600 | $29,000 | $96,600 |
| 2024 | $4,302 | $125,600 | $29,000 | $96,600 |
| 2023 | $4,302 | $125,600 | $29,000 | $96,600 |
| 2022 | $4,221 | $125,600 | $29,000 | $96,600 |
| 2021 | $4,206 | $125,600 | $29,000 | $96,600 |
| 2020 | $3,994 | $125,600 | $29,000 | $96,600 |
| 2019 | $3,825 | $125,600 | $29,000 | $96,600 |
| 2018 | $3,804 | $125,600 | $29,000 | $96,600 |
| 2017 | $3,711 | $125,600 | $29,000 | $96,600 |
| 2016 | $3,593 | $125,600 | $29,000 | $96,600 |
| 2015 | $3,459 | $125,600 | $29,000 | $96,600 |
| 2014 | $3,376 | $125,600 | $29,000 | $96,600 |
Source: Public Records
Map
Nearby Homes