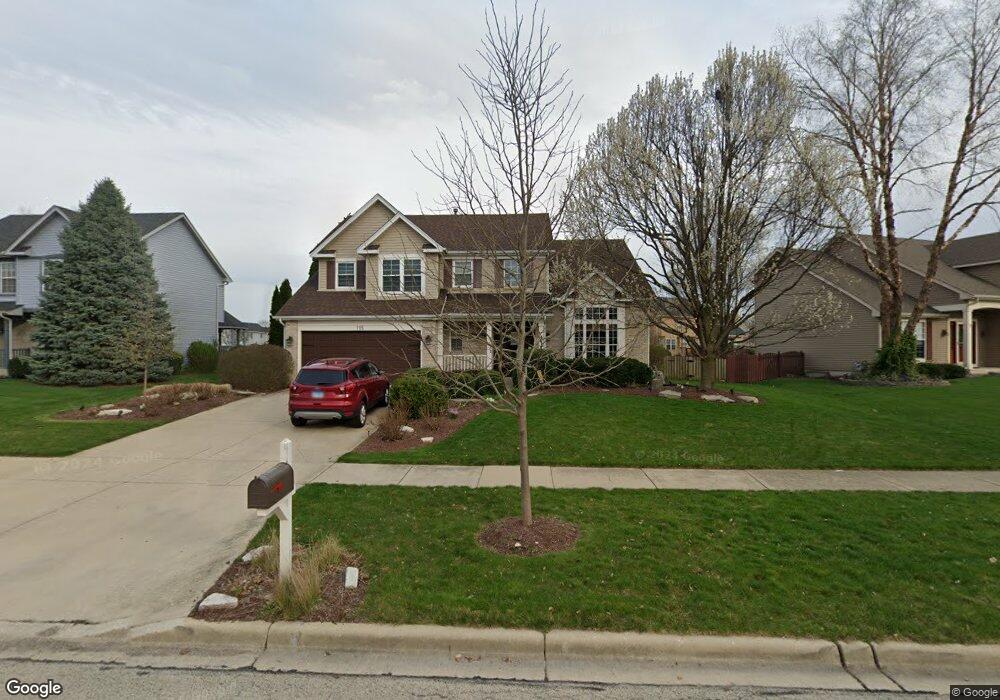
115 Pine Hill Dr North Aurora, IL 60542
Estimated Value: $432,000 - $457,000
4
Beds
4
Baths
2,120
Sq Ft
$208/Sq Ft
Est. Value
About This Home
This home is located at 115 Pine Hill Dr, North Aurora, IL 60542 and is currently estimated at $440,645, approximately $207 per square foot. 115 Pine Hill Dr is a home located in Kane County with nearby schools including Goodwin Elementary School, Jewel Middle School, and West Aurora High School.
Ownership History
Date
Name
Owned For
Owner Type
Purchase Details
Closed on
Apr 7, 2000
Sold by
Hudik Andrew J and Hudik Mary Christine L
Bought by
Greenwood Gerald F and Greenwood Karen S
Current Estimated Value
Home Financials for this Owner
Home Financials are based on the most recent Mortgage that was taken out on this home.
Original Mortgage
$198,569
Outstanding Balance
$68,323
Interest Rate
8.29%
Mortgage Type
FHA
Estimated Equity
$372,322
Purchase Details
Closed on
Apr 8, 1998
Sold by
The Old Second National Bank Of Aurora
Bought by
Hudik Andrew J and Hudik Mary Christine L
Home Financials for this Owner
Home Financials are based on the most recent Mortgage that was taken out on this home.
Original Mortgage
$165,000
Interest Rate
7.25%
Create a Home Valuation Report for This Property
The Home Valuation Report is an in-depth analysis detailing your home's value as well as a comparison with similar homes in the area
Home Values in the Area
Average Home Value in this Area
Purchase History
| Date | Buyer | Sale Price | Title Company |
|---|---|---|---|
| Greenwood Gerald F | $200,000 | First American Title Ins Co | |
| Hudik Andrew J | $193,500 | -- |
Source: Public Records
Mortgage History
| Date | Status | Borrower | Loan Amount |
|---|---|---|---|
| Open | Greenwood Gerald F | $198,569 | |
| Previous Owner | Hudik Andrew J | $165,000 |
Source: Public Records
Tax History Compared to Growth
Tax History
| Year | Tax Paid | Tax Assessment Tax Assessment Total Assessment is a certain percentage of the fair market value that is determined by local assessors to be the total taxable value of land and additions on the property. | Land | Improvement |
|---|---|---|---|---|
| 2024 | $9,217 | $131,456 | $23,352 | $108,104 |
| 2023 | $9,305 | $117,455 | $20,865 | $96,590 |
| 2022 | $8,589 | $107,167 | $19,037 | $88,130 |
| 2021 | $8,210 | $99,774 | $17,724 | $82,050 |
| 2020 | $8,665 | $103,220 | $16,463 | $86,757 |
| 2019 | $8,403 | $95,636 | $15,253 | $80,383 |
| 2018 | $8,362 | $92,787 | $14,109 | $78,678 |
| 2017 | $8,268 | $89,967 | $16,238 | $73,729 |
| 2016 | $8,267 | $87,414 | $13,919 | $73,495 |
| 2015 | -- | $76,691 | $11,969 | $64,722 |
| 2014 | -- | $71,816 | $11,512 | $60,304 |
| 2013 | -- | $72,652 | $11,348 | $61,304 |
Source: Public Records
Map
Nearby Homes
- 1403 Prairie Ct
- 71 Windstone Dr
- 1202 Fox Hill Ln Unit 362
- 311 Hidden Creek Ln Unit 311
- 201 Hidden Creek Ln Unit 301
- 316 E Victoria Cir Unit 125
- 420 Hidden Creek Ln Unit 65
- 203 E Victoria Cir Unit 9/2
- 109 E Victoria Cir Unit 7/5
- 1640 Abington Ln
- Lot 16 West Orchard Gateway Blvd
- 413 Messenger Cir
- Lot 1 North Orchard Gateway Blvd
- Lot 16 Orchard Gateway Blvd
- Lot 13 Towne Center Dr
- Lot 1 South Towne Center Dr
- Lot 5 Towne Center Dr
- Lot 6 Towne Center Dr
- 1432 Hartsburg Ln Unit 1
- 43 S Juniper Dr Unit 3
- 107 Pine Hill Dr
- 123 Pine Hill Dr
- 1375 Fox Hill Ct
- 1367 Fox Hill Ct
- 99 Pine Hill Dr
- 1383 Fox Hill Ct
- 1402 Fieldside Ln
- 1359 Fox Hill Ct
- 1401 Fieldside Ln
- 91 Pine Hill Dr
- 139 Pine Hill Dr
- 1391 Fox Hill Ct
- 116 Pine Hill Dr
- 1410 Fieldside Ln
- 1409 Fieldside Ln
- 108 Pine Hill Dr
- 50 White Oak Dr Unit 1
- 83 Pine Hill Dr Unit 1
- 1366 Fox Hill Ct
- 100 Pine Hill Dr