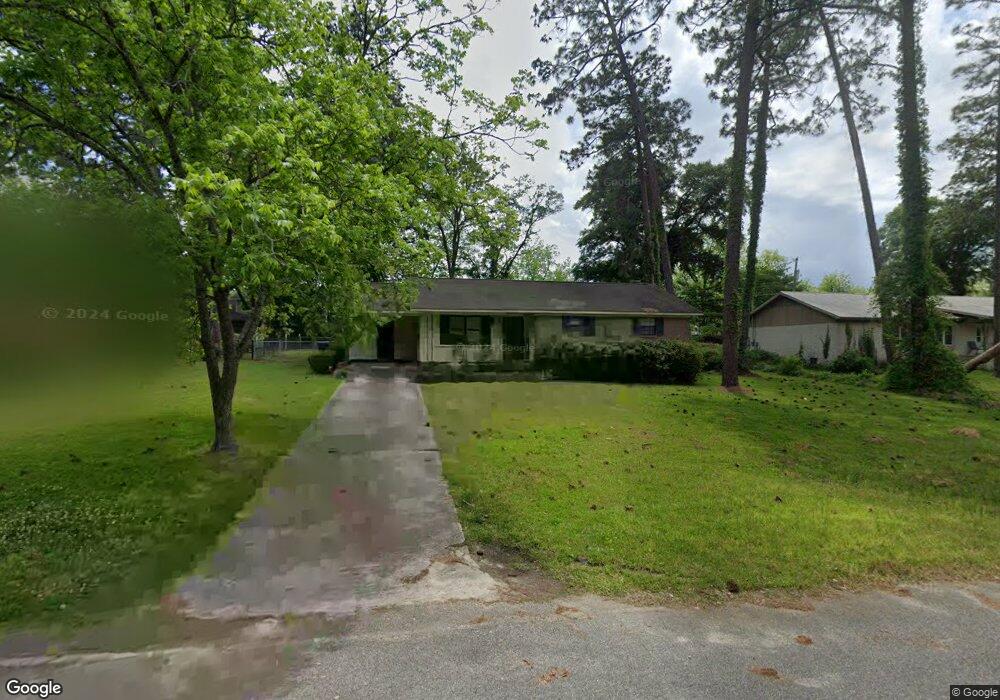
115 Poplar St Fitzgerald, GA 31750
Estimated Value: $112,000 - $199,000
3
Beds
2
Baths
1,179
Sq Ft
$126/Sq Ft
Est. Value
About This Home
This home is located at 115 Poplar St, Fitzgerald, GA 31750 and is currently estimated at $148,022, approximately $125 per square foot. 115 Poplar St is a home located in Ben Hill County with nearby schools including Ben Hill County Primary School, Ben Hill Elementary School, and Ben Hill County Middle School.
Ownership History
Date
Name
Owned For
Owner Type
Purchase Details
Closed on
Oct 17, 2017
Sold by
Harper Emily Joy
Bought by
E Harper Investments Llc
Current Estimated Value
Purchase Details
Closed on
Jul 25, 2017
Bought by
Harper Emily Joy
Purchase Details
Closed on
Jun 6, 2017
Sold by
Culpepper Joseph Chesley
Bought by
Lakeview Loan Servicing Llc
Purchase Details
Closed on
Nov 6, 2015
Sold by
Howell Sammy O
Bought by
Culpepper Joseph Chesley
Home Financials for this Owner
Home Financials are based on the most recent Mortgage that was taken out on this home.
Original Mortgage
$78,551
Interest Rate
3.62%
Mortgage Type
FHA
Purchase Details
Closed on
Feb 26, 1997
Sold by
Howell Jessie J
Bought by
Howell Sammy O
Purchase Details
Closed on
Dec 7, 1984
Bought by
Howell Jessie J
Purchase Details
Closed on
Jul 15, 1983
Bought by
Josey Dennis
Create a Home Valuation Report for This Property
The Home Valuation Report is an in-depth analysis detailing your home's value as well as a comparison with similar homes in the area
Home Values in the Area
Average Home Value in this Area
Purchase History
| Date | Buyer | Sale Price | Title Company |
|---|---|---|---|
| E Harper Investments Llc | -- | -- | |
| Harper Emily Joy | $52,500 | -- | |
| Lakeview Loan Servicing Llc | $52,360 | -- | |
| Culpepper Joseph Chesley | $80,000 | -- | |
| Howell Sammy O | $31,300 | -- | |
| Howell Jessie J | $36,500 | -- | |
| Josey Dennis | $5,400 | -- |
Source: Public Records
Mortgage History
| Date | Status | Borrower | Loan Amount |
|---|---|---|---|
| Previous Owner | Culpepper Joseph Chesley | $78,551 |
Source: Public Records
Tax History Compared to Growth
Tax History
| Year | Tax Paid | Tax Assessment Tax Assessment Total Assessment is a certain percentage of the fair market value that is determined by local assessors to be the total taxable value of land and additions on the property. | Land | Improvement |
|---|---|---|---|---|
| 2024 | $1,416 | $33,184 | $3,200 | $29,984 |
| 2023 | $988 | $32,220 | $3,200 | $29,020 |
| 2022 | $922 | $27,886 | $3,200 | $24,686 |
| 2021 | $885 | $25,753 | $3,200 | $22,553 |
| 2020 | $888 | $25,559 | $3,200 | $22,359 |
| 2019 | $885 | $25,559 | $3,200 | $22,359 |
| 2018 | $1,095 | $25,422 | $3,200 | $22,222 |
| 2017 | $767 | $28,042 | $3,200 | $24,842 |
| 2016 | $693 | $26,842 | $3,200 | $23,642 |
| 2015 | -- | $26,826 | $3,200 | $23,626 |
| 2014 | -- | $27,301 | $3,200 | $24,101 |
Source: Public Records
Map
Nearby Homes
- 112 Manor Dr
- 146 Franklin Ave
- 114 Creole Ct
- 112 Perry House Rd
- 141 Wenona Way
- 243 Perry House Rd
- 107 Manassas Place
- 211 W Roanoke Dr
- 602 W Jessamine St
- 105 Halsey St
- 178 Burnside Rd
- 0 Lincoln Ave
- 509 W Jessamine St
- 516 W Magnolia St
- 113 S Merrimac Dr
- 809 W Pine St
- 210 W Jessamine St
- 409 W Magnolia St
- 816 W Central Ave
- 118 Irwinville Hwy
- 113 Poplar St
- 119 Poplar St
- 116 Loraine Ave
- 109 Poplar St
- 105 Poplar St
- 113 Hemlock St
- 113 Loraine Ave
- 118 Poplar St
- 119 Loraine Ave
- 109 Hemlock St
- 102 Loraine Ave
- 162 Haile Booker Rd
- 109 Loraine Ave
- 105 Hemlock St
- 152 Haile Booker Rd
- 115 Ash St
- 102 Hemlock St
- 119 Ash St
- 103 Loraine Ave
- 180 Haile Booker Rd