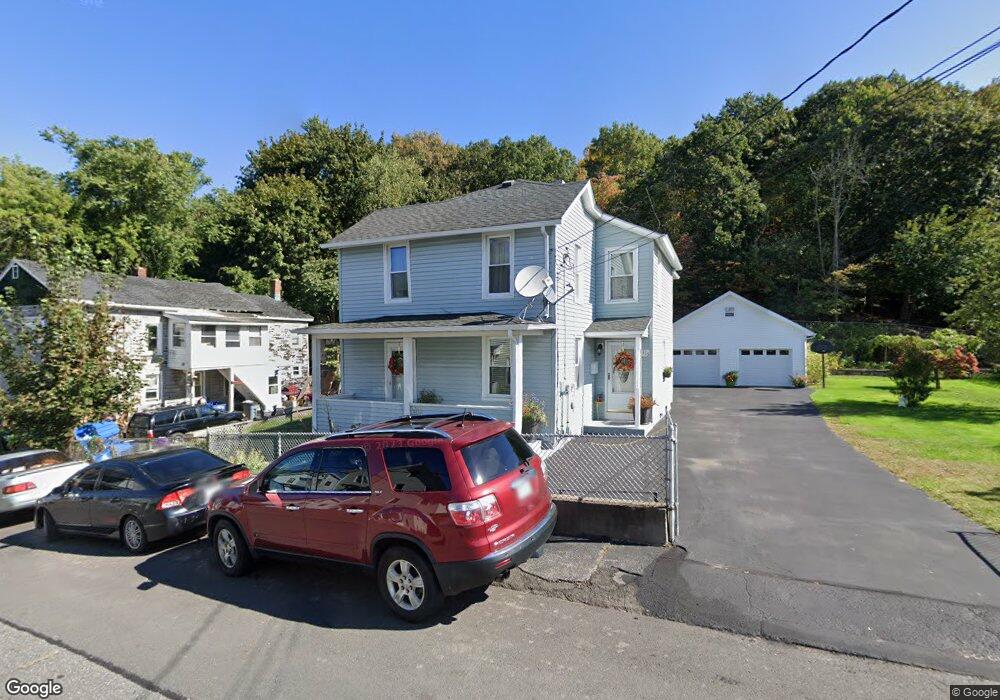
115 Ridge St Waterbury, CT 06706
South End District NeighborhoodEstimated Value: $246,328 - $287,000
4
Beds
2
Baths
1,468
Sq Ft
$184/Sq Ft
Est. Value
About This Home
This home is located at 115 Ridge St, Waterbury, CT 06706 and is currently estimated at $269,582, approximately $183 per square foot. 115 Ridge St is a home located in New Haven County with nearby schools including Wendell L. Cross Elementary School, Michael F. Wallace Middle School, and Crosby High School.
Ownership History
Date
Name
Owned For
Owner Type
Purchase Details
Closed on
Nov 4, 2004
Sold by
Usa Va
Bought by
Ali Nazil
Current Estimated Value
Home Financials for this Owner
Home Financials are based on the most recent Mortgage that was taken out on this home.
Original Mortgage
$63,400
Outstanding Balance
$31,491
Interest Rate
5.71%
Mortgage Type
Purchase Money Mortgage
Estimated Equity
$238,091
Purchase Details
Closed on
Nov 28, 1988
Sold by
Gravel Donald
Bought by
Yarington Edward
Create a Home Valuation Report for This Property
The Home Valuation Report is an in-depth analysis detailing your home's value as well as a comparison with similar homes in the area
Home Values in the Area
Average Home Value in this Area
Purchase History
| Date | Buyer | Sale Price | Title Company |
|---|---|---|---|
| Ali Nazil | $70,500 | -- | |
| Yarington Edward | $103,000 | -- |
Source: Public Records
Mortgage History
| Date | Status | Borrower | Loan Amount |
|---|---|---|---|
| Open | Yarington Edward | $63,400 | |
| Previous Owner | Yarington Edward | $95,000 |
Source: Public Records
Tax History Compared to Growth
Tax History
| Year | Tax Paid | Tax Assessment Tax Assessment Total Assessment is a certain percentage of the fair market value that is determined by local assessors to be the total taxable value of land and additions on the property. | Land | Improvement |
|---|---|---|---|---|
| 2025 | $3,980 | $88,480 | $13,790 | $74,690 |
| 2024 | $4,374 | $88,480 | $13,790 | $74,690 |
| 2023 | $4,795 | $88,480 | $13,790 | $74,690 |
| 2022 | $3,055 | $50,740 | $13,780 | $36,960 |
| 2021 | $3,055 | $50,740 | $13,780 | $36,960 |
| 2020 | $3,055 | $50,740 | $13,780 | $36,960 |
| 2019 | $3,055 | $50,740 | $13,780 | $36,960 |
| 2018 | $3,055 | $50,740 | $13,780 | $36,960 |
| 2017 | $3,170 | $52,650 | $13,780 | $38,870 |
| 2016 | $3,170 | $52,650 | $13,780 | $38,870 |
| 2015 | $3,065 | $52,650 | $13,780 | $38,870 |
| 2014 | $3,065 | $52,650 | $13,780 | $38,870 |
Source: Public Records
Map
Nearby Homes