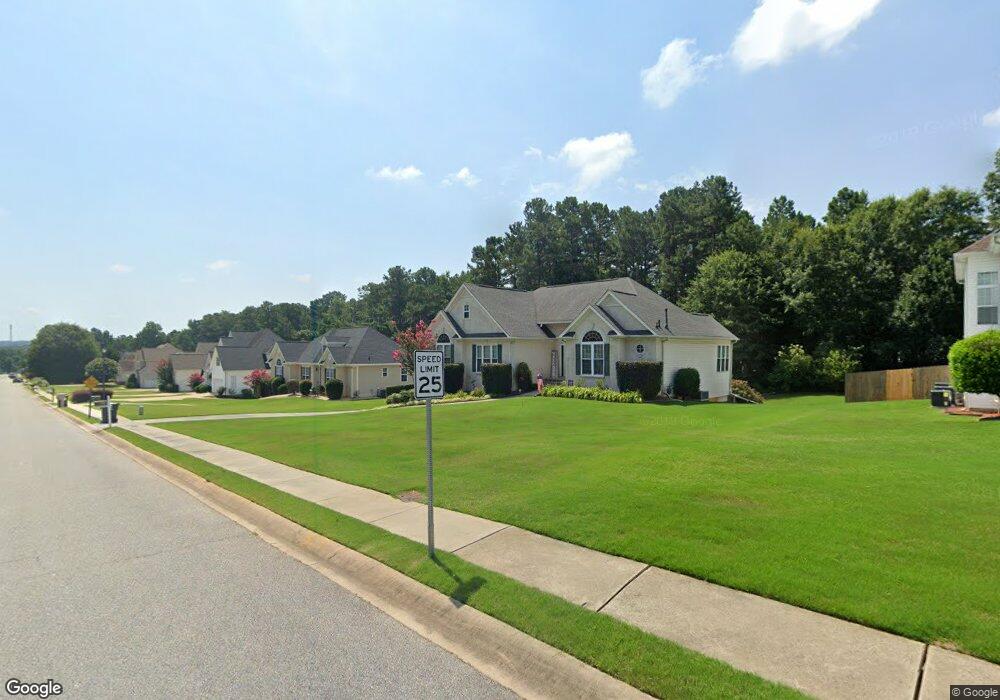
115 Ridgecrest Dr Unit 2 Fayetteville, GA 30215
Estimated Value: $431,000 - $476,000
--
Bed
3
Baths
1,804
Sq Ft
$248/Sq Ft
Est. Value
About This Home
This home is located at 115 Ridgecrest Dr Unit 2, Fayetteville, GA 30215 and is currently estimated at $448,039, approximately $248 per square foot. 115 Ridgecrest Dr Unit 2 is a home located in Fayette County with nearby schools including Cleveland Elementary School, Bennett's Mill Middle School, and Fayette County High School.
Ownership History
Date
Name
Owned For
Owner Type
Purchase Details
Closed on
Jun 12, 2003
Sold by
Sellers Ty S and Sellers Crystal
Bought by
Kahley Kevin R and Kahley Penny
Current Estimated Value
Home Financials for this Owner
Home Financials are based on the most recent Mortgage that was taken out on this home.
Original Mortgage
$171,600
Outstanding Balance
$72,546
Interest Rate
5.3%
Mortgage Type
New Conventional
Estimated Equity
$375,493
Purchase Details
Closed on
Aug 31, 2001
Sold by
Simpson Troy and Simpson Leah
Bought by
Sellers Ty S and Sellers Crystal
Home Financials for this Owner
Home Financials are based on the most recent Mortgage that was taken out on this home.
Original Mortgage
$181,710
Interest Rate
5.63%
Mortgage Type
New Conventional
Purchase Details
Closed on
Dec 27, 1999
Sold by
Chris Dixon & Assocs Inc
Bought by
Simpson Troy and Simpson Leah
Home Financials for this Owner
Home Financials are based on the most recent Mortgage that was taken out on this home.
Original Mortgage
$187,900
Interest Rate
7.88%
Mortgage Type
VA
Create a Home Valuation Report for This Property
The Home Valuation Report is an in-depth analysis detailing your home's value as well as a comparison with similar homes in the area
Home Values in the Area
Average Home Value in this Area
Purchase History
| Date | Buyer | Sale Price | Title Company |
|---|---|---|---|
| Kahley Kevin R | $214,600 | -- | |
| Sellers Ty S | $201,900 | -- | |
| Simpson Troy | $187,900 | -- |
Source: Public Records
Mortgage History
| Date | Status | Borrower | Loan Amount |
|---|---|---|---|
| Open | Kahley Kevin R | $171,600 | |
| Previous Owner | Sellers Ty S | $181,710 | |
| Previous Owner | Simpson Troy | $187,900 |
Source: Public Records
Tax History Compared to Growth
Tax History
| Year | Tax Paid | Tax Assessment Tax Assessment Total Assessment is a certain percentage of the fair market value that is determined by local assessors to be the total taxable value of land and additions on the property. | Land | Improvement |
|---|---|---|---|---|
| 2024 | $4,036 | $182,112 | $30,400 | $151,712 |
| 2023 | $3,521 | $174,640 | $30,400 | $144,240 |
| 2022 | $3,765 | $155,760 | $30,400 | $125,360 |
| 2021 | $3,367 | $121,800 | $17,600 | $104,200 |
| 2020 | $3,332 | $109,800 | $17,600 | $92,200 |
| 2019 | $3,227 | $105,400 | $17,600 | $87,800 |
| 2018 | $3,085 | $99,800 | $17,600 | $82,200 |
| 2017 | $2,936 | $100,360 | $17,600 | $82,760 |
| 2016 | $2,573 | $86,400 | $17,600 | $68,800 |
| 2015 | $2,296 | $76,040 | $17,600 | $58,440 |
| 2014 | $2,125 | $69,320 | $17,600 | $51,720 |
| 2013 | -- | $69,920 | $0 | $0 |
Source: Public Records
Map
Nearby Homes
- 140 Ridgecrest Dr Unit 2
- 165 Blackjack Ct
- 230 Hidden Brook Trail
- 155 Mine Run
- 155 Cottage Cir
- 175 Ferncliff
- 140 Rockglen Ct
- 130 Edgewater Trail
- 120 Godby Dr
- 322 Hambrick Park
- 180 Sunderland Cir
- 262 Otter Cir
- 0 Davis Rd Unit 10490616
- 227 Blue Point Pkwy
- 490 Grand Teton Cir
- 470 Grand Teton Cir
- 125 Nina Celeste Ln
- 335 Burch Rd
- 335 Grand Teton Cir
- 573 Lester Rd
- 125 Ridgecrest Dr
- 105 Ridgecrest Dr Unit 2
- 110 Deep Hollow Ct Unit 1
- 120 Hidden Brook Trail
- 135 Ridgecrest Dr Unit 104
- 135 Ridgecrest Dr
- 110 Ridgecrest Dr Unit 2
- 120 Deep Hollow Ct
- 120 Ridgecrest Dr Unit 2
- 100 Hidden Brook Trail Unit 2
- 145 Ridgecrest Dr Unit 2
- 0 Deep Hollow Ct Unit 3244764
- 130 Ridgecrest Dr Unit 4
- 130 Ridgecrest Dr
- 125 Hidden Brook Trail Unit 120
- 125 Hidden Brook Trail
- 135 Hidden Brook Trail Unit 1
- 115 Hidden Brook Trail
- 130 Deep Hollow Ct
- 145 Hidden Brook Trail Unit 1