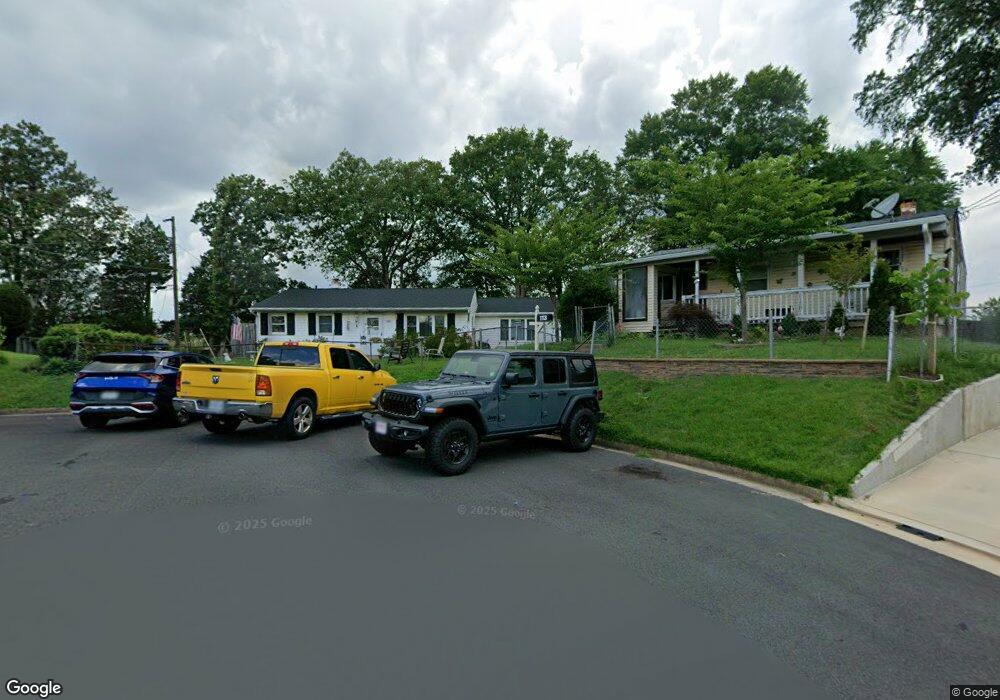
115 Runyon Ct Manassas Park, VA 20111
Estimated Value: $421,000 - $503,000
3
Beds
1
Bath
1,382
Sq Ft
$327/Sq Ft
Est. Value
About This Home
This home is located at 115 Runyon Ct, Manassas Park, VA 20111 and is currently estimated at $451,337, approximately $326 per square foot. 115 Runyon Ct is a home located in Manassas Park City with nearby schools including Cougar Elementary School, Manassas Park Elementary School, and Manassas Park Middle School.
Ownership History
Date
Name
Owned For
Owner Type
Purchase Details
Closed on
Mar 14, 2002
Sold by
Williams Mary June
Bought by
Taylor James L
Current Estimated Value
Home Financials for this Owner
Home Financials are based on the most recent Mortgage that was taken out on this home.
Original Mortgage
$121,900
Outstanding Balance
$50,849
Interest Rate
7.04%
Mortgage Type
FHA
Estimated Equity
$400,488
Create a Home Valuation Report for This Property
The Home Valuation Report is an in-depth analysis detailing your home's value as well as a comparison with similar homes in the area
Home Values in the Area
Average Home Value in this Area
Purchase History
| Date | Buyer | Sale Price | Title Company |
|---|---|---|---|
| Taylor James L | $122,900 | -- |
Source: Public Records
Mortgage History
| Date | Status | Borrower | Loan Amount |
|---|---|---|---|
| Open | Taylor James L | $121,900 |
Source: Public Records
Tax History Compared to Growth
Tax History
| Year | Tax Paid | Tax Assessment Tax Assessment Total Assessment is a certain percentage of the fair market value that is determined by local assessors to be the total taxable value of land and additions on the property. | Land | Improvement |
|---|---|---|---|---|
| 2025 | $5,102 | $431,600 | $155,700 | $275,900 |
| 2024 | $5,102 | $379,100 | $141,500 | $237,600 |
| 2023 | $5,102 | $351,000 | $113,200 | $237,800 |
| 2022 | $4,890 | $340,800 | $107,800 | $233,000 |
| 2021 | $4,633 | $309,800 | $93,700 | $216,100 |
| 2020 | $4,359 | $289,500 | $78,300 | $211,200 |
| 2019 | $4,359 | $271,800 | $78,000 | $193,800 |
| 2018 | $3,813 | $256,400 | $73,500 | $182,900 |
| 2017 | $0 | $244,100 | $73,500 | $170,600 |
| 2016 | $3,691 | $238,100 | $73,500 | $164,600 |
| 2015 | $2,618 | $222,500 | $73,500 | $149,000 |
| 2014 | $2,618 | $184,700 | $73,500 | $111,200 |
Source: Public Records
Map
Nearby Homes
- 107 Luxor St
- 186 Lambert Dr
- 135 Polk Dr
- 8006 Well St
- 185 Cabbel Dr
- 7636 Shelley Ln
- 7613 Glenolden Place
- 319 Moseby Ct Unit E
- 7601 Bull Run Rd
- 7505 Bosbury Ct
- 504 Tassita Ln
- 8321 Maplewood Dr
- 8401 Yorkshire Ln
- 8334 Shady Grove Cir
- 9274 Bayberry Ave
- 8117 Leland Rd
- 8111 Oak St
- 7407 Peppertree Ln
- 8396 Woodline Ct
- 9022 New Britain Cir