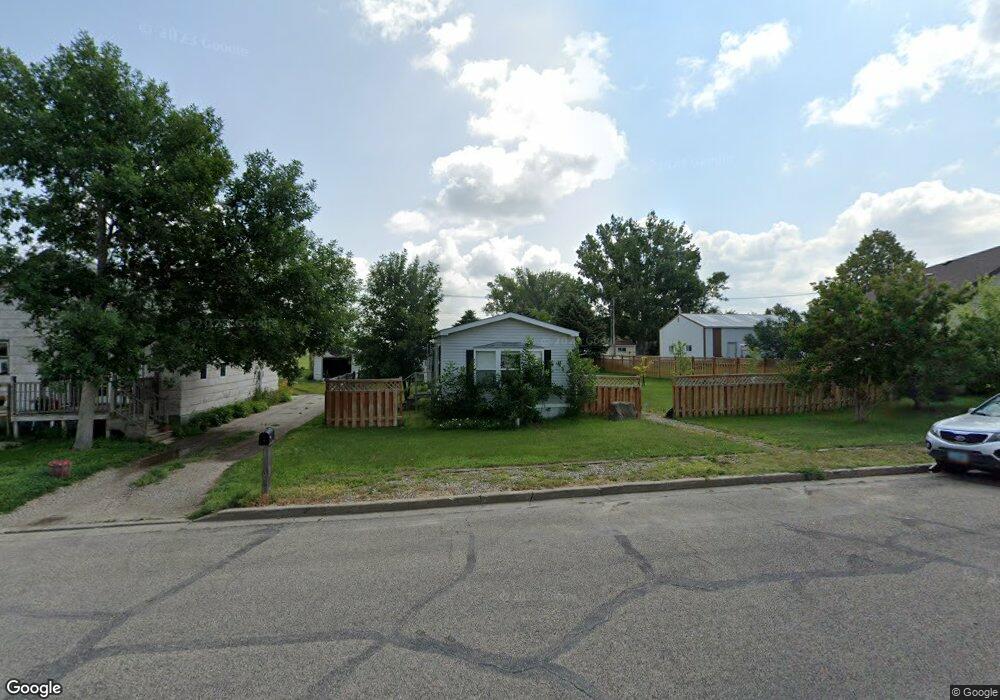
115 S 10th St Wishek, ND 58495
Estimated Value: $85,241 - $150,000
--
Bed
--
Bath
--
Sq Ft
--
Built
About This Home
This home is located at 115 S 10th St, Wishek, ND 58495 and is currently estimated at $118,560. 115 S 10th St is a home located in McIntosh County with nearby schools including Wishek Elementary School and Wishek High School.
Ownership History
Date
Name
Owned For
Owner Type
Purchase Details
Closed on
Jan 3, 2023
Sold by
Sperling Craig D and Sperling Lori A
Bought by
Christenson Jon T and Christenson Brenda L
Current Estimated Value
Purchase Details
Closed on
Feb 19, 2022
Sold by
Scherer Alethea and Scherer Justin
Bought by
Christenson Jon T and Christenson Brenda L
Purchase Details
Closed on
May 6, 2021
Sold by
Hatlewick and Kelly
Bought by
Scherer Alethea and Scherer Justin
Home Financials for this Owner
Home Financials are based on the most recent Mortgage that was taken out on this home.
Original Mortgage
$63,822
Interest Rate
2.28%
Mortgage Type
Construction
Purchase Details
Closed on
Mar 21, 2018
Sold by
Brandner Nancy L
Bought by
Hatlewick Jeffrey
Home Financials for this Owner
Home Financials are based on the most recent Mortgage that was taken out on this home.
Original Mortgage
$34,100
Interest Rate
4.38%
Mortgage Type
New Conventional
Create a Home Valuation Report for This Property
The Home Valuation Report is an in-depth analysis detailing your home's value as well as a comparison with similar homes in the area
Home Values in the Area
Average Home Value in this Area
Purchase History
| Date | Buyer | Sale Price | Title Company |
|---|---|---|---|
| Christenson Jon T | -- | Attorney Only | |
| Christenson Jon T | $82,500 | Attorney Only | |
| Scherer Alethea | $65,000 | North Dakota Guaranty & Title | |
| Hatlewick Jeffrey | $42,625 | North Dakota Guaranty & Title |
Source: Public Records
Mortgage History
| Date | Status | Borrower | Loan Amount |
|---|---|---|---|
| Previous Owner | Scherer Alethea | $63,822 | |
| Previous Owner | Hatlewick Jeffrey | $34,100 |
Source: Public Records
Tax History Compared to Growth
Tax History
| Year | Tax Paid | Tax Assessment Tax Assessment Total Assessment is a certain percentage of the fair market value that is determined by local assessors to be the total taxable value of land and additions on the property. | Land | Improvement |
|---|---|---|---|---|
| 2024 | $1,242 | $36,500 | $4,050 | $32,450 |
| 2023 | $1,183 | $35,850 | $4,050 | $31,800 |
| 2022 | $1,006 | $31,550 | $3,950 | $27,600 |
| 2021 | $1,012 | $31,350 | $3,750 | $27,600 |
| 2020 | $1,007 | $31,350 | $3,750 | $27,600 |
| 2019 | $1,075 | $32,753 | $972 | $31,781 |
| 2018 | $940 | $32,753 | $972 | $31,781 |
| 2017 | -- | $50,261 | $1,808 | $48,453 |
| 2016 | -- | $48,850 | $1,808 | $47,042 |
| 2015 | -- | $0 | $0 | $0 |
| 2014 | -- | $0 | $0 | $0 |
| 2013 | $605 | $0 | $0 | $0 |
Source: Public Records
Map
Nearby Homes
- 121 S Badger St
- 121 S 9th St
- 209 S Badger St
- 308 S 10th St
- 307 S 9th St
- 811 1st Ave N
- 601 & 603 Badger St S
- 115 5th St S
- 8130 N Dakota 3
- 8255 3rd St S
- 8155 34th Ave SE
- 7551 37th Ave SE
- 304 Main St
- 113 Main St N
- 7162 Cabin Ave E
- 9537 38th Ave SE
- 9510 32nd Ave SE
- 408 Center Ave N
- 308 2nd Ave NE
- 213 1st St SW