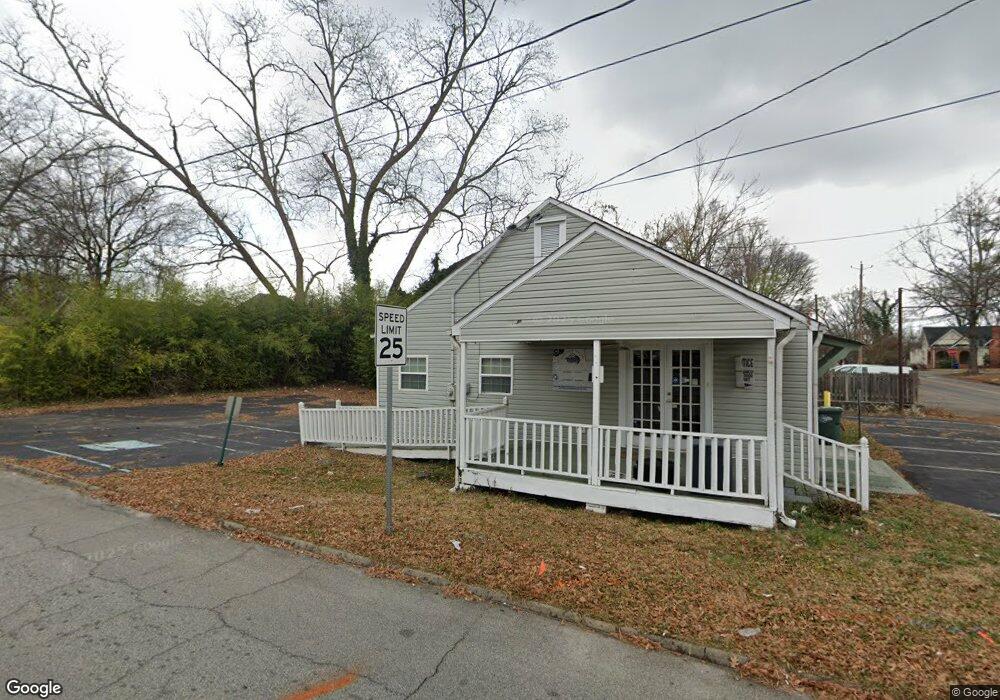
115 S 12th St Griffin, GA 30223
Spalding County NeighborhoodEstimated Value: $122,519
3
Beds
1
Bath
1,280
Sq Ft
$96/Sq Ft
Est. Value
About This Home
This home is located at 115 S 12th St, Griffin, GA 30223 and is currently estimated at $122,519, approximately $95 per square foot. 115 S 12th St is a home located in Spalding County with nearby schools including Anne Street Elementary School, Rehoboth Road Middle School, and Griffin High School.
Ownership History
Date
Name
Owned For
Owner Type
Purchase Details
Closed on
Jan 24, 2020
Sold by
Burkhalter Rentals Llc
Bought by
Mayfield Eddie
Current Estimated Value
Purchase Details
Closed on
May 24, 2002
Sold by
Burkwalter Harry W and Burkwalter Sandra S
Bought by
Burkwalter Harry W and Burkwalter Sandra S
Purchase Details
Closed on
Mar 29, 1988
Sold by
Jones Elizabeth W
Bought by
Burkhalter Harry W Etal
Purchase Details
Closed on
Aug 18, 1986
Sold by
Wilson Donald L and Jones Elizabeth W
Bought by
Jones Elizabeth W
Purchase Details
Closed on
Mar 6, 1986
Sold by
Glover Robert H
Bought by
Wilson Donald L and Jones Elizabet
Purchase Details
Closed on
Nov 23, 1973
Sold by
Benkek Jack Joseph and Benkek Pamela C
Bought by
Glover Robert H
Purchase Details
Closed on
Nov 14, 1972
Sold by
Benkek Jack Joseph and Blackmon Evelyn L
Bought by
Bendek Jack Joseph and Bendek Pamela C
Purchase Details
Closed on
Nov 9, 1970
Sold by
Mathews William Bruice
Bought by
Bendek Jack Joseph and Blackmon Evely
Create a Home Valuation Report for This Property
The Home Valuation Report is an in-depth analysis detailing your home's value as well as a comparison with similar homes in the area
Home Values in the Area
Average Home Value in this Area
Purchase History
| Date | Buyer | Sale Price | Title Company |
|---|---|---|---|
| Mayfield Eddie | $66,300 | -- | |
| Burkwalter Harry W | -- | -- | |
| Burkhalter Harry W | -- | -- | |
| Burkhalter Harry W Etal | $60,000 | -- | |
| Jones Elizabeth W | -- | -- | |
| Wilson Donald L | $35,000 | -- | |
| Glover Robert H | $8,000 | -- | |
| Bendek Jack Joseph | -- | -- | |
| Bendek Jack Joseph | $15,000 | -- |
Source: Public Records
Tax History Compared to Growth
Tax History
| Year | Tax Paid | Tax Assessment Tax Assessment Total Assessment is a certain percentage of the fair market value that is determined by local assessors to be the total taxable value of land and additions on the property. | Land | Improvement |
|---|---|---|---|---|
| 2024 | $1,208 | $31,626 | $12,800 | $18,826 |
| 2023 | $1,208 | $30,059 | $12,800 | $17,259 |
| 2022 | $1,145 | $28,651 | $12,800 | $15,851 |
| 2021 | $1,060 | $27,209 | $12,800 | $14,409 |
| 2020 | $1,087 | $27,209 | $12,800 | $14,409 |
| 2019 | $995 | $24,447 | $12,800 | $11,647 |
| 2018 | $986 | $23,353 | $12,800 | $10,553 |
| 2017 | $965 | $23,353 | $12,800 | $10,553 |
| 2016 | $981 | $23,353 | $12,800 | $10,553 |
| 2015 | $997 | $23,353 | $12,800 | $10,553 |
| 2014 | $1,027 | $23,353 | $12,800 | $10,553 |
Source: Public Records
Map
Nearby Homes
- 737 W Solomon St
- 733 W Broad St
- 108 N 14th St
- 711 W Broad St
- 822 W Solomon St
- 320 S 12th St
- 221 N 14th St
- 915 W Poplar St
- 332 N 14th St
- 930 W Broad St
- 321 N 10th St
- 333 N 10th St
- 218 W Central Ave
- 411 Palace St
- 1017 W Broad St
- 325 W Quilly St
- 318 N 15th St
- 525 W Quilly St
- 1025 W Broad St
- 629 Williams St
- 123 S 12th St
- 127 S 12th St
- 612 W Solomon St
- 614 W Solomon St
- 620 W Solomon St Unit 624
- 620 W Solomon St
- 624 W Solomon St
- 524 W Solomon St
- 605 W Solomon St
- 116 S 13th St
- 611 W Solomon St
- 607 W Solomon St
- 522 W Solomon St
- 529 W Solomon St
- 619 W Solomon St
- 527 W Solomon St
- 625 W Solomon St
- 523 W Solomon St
- 105 S 11th St
- 504 W Solomon St