Estimated Value: $119,000 - $157,629
3
Beds
1
Bath
1,377
Sq Ft
$95/Sq Ft
Est. Value
About This Home
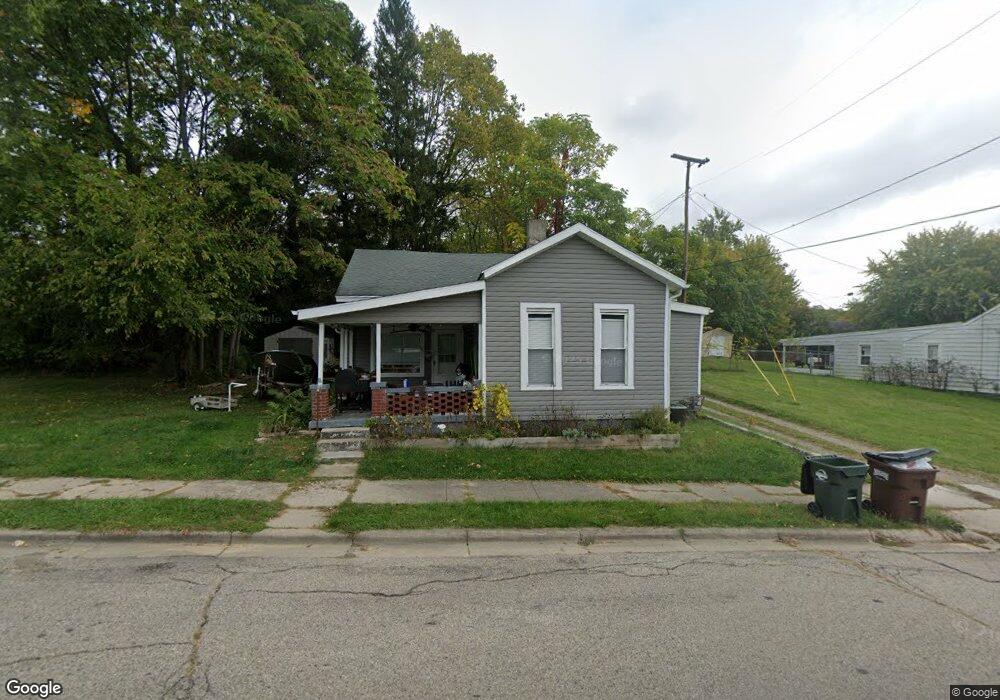
This home is located at 115 S Columbus St, Xenia, OH 45385 and is currently estimated at $131,407, approximately $95 per square foot. 115 S Columbus St is a home located in Greene County with nearby schools including Xenia High School, Summit Academy Community School for Alternative Learners - Xenia, and Legacy Christian Academy.
Ownership History
Date
Name
Owned For
Owner Type
Purchase Details
Closed on
Sep 17, 2019
Sold by
Adams Chris
Bought by
Bowen Elizabeth G and Bowen Tristan
Current Estimated Value
Home Financials for this Owner
Home Financials are based on the most recent Mortgage that was taken out on this home.
Original Mortgage
$77,995
Outstanding Balance
$68,318
Interest Rate
3.6%
Mortgage Type
New Conventional
Estimated Equity
$63,089
Purchase Details
Closed on
Dec 29, 2017
Sold by
Gibson Timothy John
Bought by
Adams Chris
Purchase Details
Closed on
Sep 23, 2016
Bought by
Gibson Timothy John
Create a Home Valuation Report for This Property
The Home Valuation Report is an in-depth analysis detailing your home's value as well as a comparison with similar homes in the area
Home Values in the Area
Average Home Value in this Area
Purchase History
| Date | Buyer | Sale Price | Title Company |
|---|---|---|---|
| Bowen Elizabeth G | $82,100 | Chicago Title Company Llc | |
| Adams Chris | $14,000 | -- | |
| Gibson Timothy John | -- | -- |
Source: Public Records
Mortgage History
| Date | Status | Borrower | Loan Amount |
|---|---|---|---|
| Open | Bowen Elizabeth G | $77,995 |
Source: Public Records
Tax History Compared to Growth
Tax History
| Year | Tax Paid | Tax Assessment Tax Assessment Total Assessment is a certain percentage of the fair market value that is determined by local assessors to be the total taxable value of land and additions on the property. | Land | Improvement |
|---|---|---|---|---|
| 2024 | $1,688 | $39,440 | $1,170 | $38,270 |
| 2023 | $1,688 | $39,440 | $1,170 | $38,270 |
| 2022 | $1,383 | $27,570 | $1,060 | $26,510 |
| 2021 | $1,402 | $27,570 | $1,060 | $26,510 |
| 2020 | $1,343 | $27,570 | $1,060 | $26,510 |
| 2019 | $254 | $4,900 | $1,520 | $3,380 |
| 2018 | $255 | $4,900 | $1,520 | $3,380 |
| 2017 | $622 | $10,600 | $1,520 | $9,080 |
| 2016 | $539 | $10,180 | $1,520 | $8,660 |
| 2015 | $540 | $10,180 | $1,520 | $8,660 |
| 2014 | $517 | $10,180 | $1,520 | $8,660 |
Source: Public Records
Map
Nearby Homes