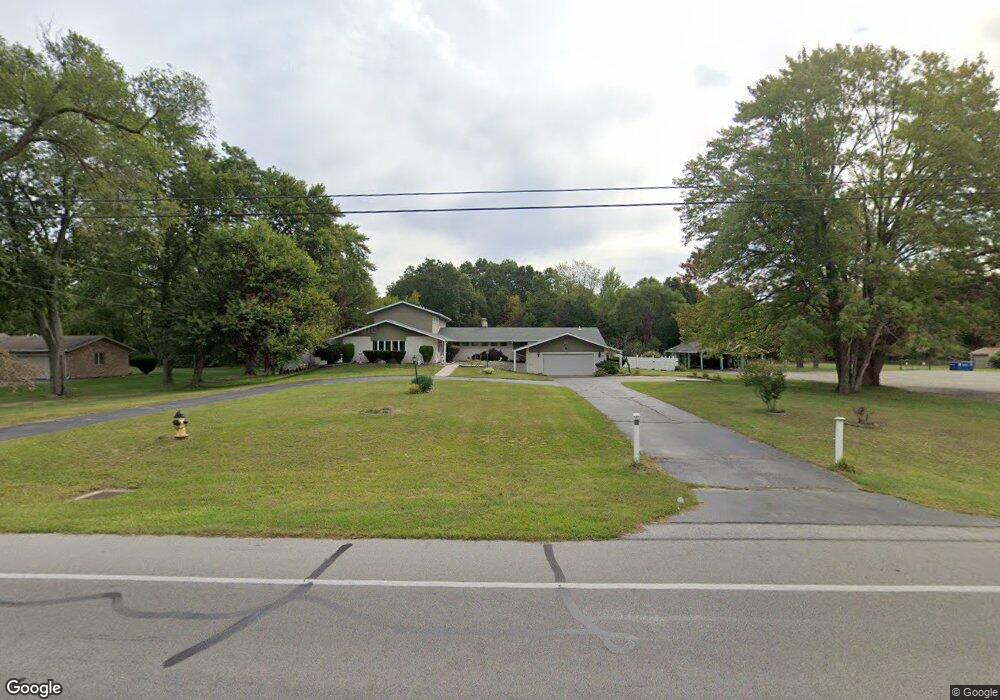
115 S King Rd Holland, OH 43528
Estimated Value: $354,000 - $477,000
4
Beds
3
Baths
3,034
Sq Ft
$131/Sq Ft
Est. Value
About This Home
This home is located at 115 S King Rd, Holland, OH 43528 and is currently estimated at $397,608, approximately $131 per square foot. 115 S King Rd is a home located in Lucas County with nearby schools including Dorr Street Elementary School, Springfield Middle School, and Springfield High School.
Ownership History
Date
Name
Owned For
Owner Type
Purchase Details
Closed on
Jun 4, 2018
Sold by
Boyce Floyd Delanie Jo
Bought by
Boyce Floyd Delanie Jo and Alarcon Charree Atonya
Current Estimated Value
Purchase Details
Closed on
Mar 7, 2016
Sold by
Floyd Rickie L
Bought by
Boyce Floyd Delanie J
Purchase Details
Closed on
Jul 2, 2009
Sold by
Boyce Floyd Delanie J and Floyd Rickie L
Bought by
Floyd Rickie L and Boyce Floyd Delanie J
Home Financials for this Owner
Home Financials are based on the most recent Mortgage that was taken out on this home.
Original Mortgage
$176,638
Outstanding Balance
$113,098
Interest Rate
4.94%
Mortgage Type
FHA
Estimated Equity
$284,510
Purchase Details
Closed on
Nov 6, 2003
Sold by
Boyce Delanie J and Boyce Teandrea
Bought by
Boyce Delanie J
Home Financials for this Owner
Home Financials are based on the most recent Mortgage that was taken out on this home.
Original Mortgage
$121,000
Interest Rate
6.01%
Mortgage Type
Purchase Money Mortgage
Purchase Details
Closed on
Dec 21, 1995
Sold by
Connor William R
Bought by
Boyce Delanie J and Boyce Teandrea
Home Financials for this Owner
Home Financials are based on the most recent Mortgage that was taken out on this home.
Original Mortgage
$99,000
Interest Rate
7.43%
Mortgage Type
New Conventional
Create a Home Valuation Report for This Property
The Home Valuation Report is an in-depth analysis detailing your home's value as well as a comparison with similar homes in the area
Home Values in the Area
Average Home Value in this Area
Purchase History
| Date | Buyer | Sale Price | Title Company |
|---|---|---|---|
| Boyce Floyd Delanie Jo | -- | None Available | |
| Boyce Floyd Delanie J | -- | None Available | |
| Floyd Rickie L | -- | Liberty Title Inc | |
| Boyce Delanie J | -- | -- | |
| Boyce Delanie J | $110,000 | -- |
Source: Public Records
Mortgage History
| Date | Status | Borrower | Loan Amount |
|---|---|---|---|
| Open | Floyd Rickie L | $176,638 | |
| Closed | Boyce Delanie J | $121,000 | |
| Closed | Boyce Delanie J | $99,000 |
Source: Public Records
Tax History Compared to Growth
Tax History
| Year | Tax Paid | Tax Assessment Tax Assessment Total Assessment is a certain percentage of the fair market value that is determined by local assessors to be the total taxable value of land and additions on the property. | Land | Improvement |
|---|---|---|---|---|
| 2024 | $2,562 | $94,570 | $12,600 | $81,970 |
| 2023 | $5,261 | $85,400 | $4,760 | $80,640 |
| 2022 | $5,289 | $85,400 | $4,760 | $80,640 |
| 2021 | $4,971 | $85,400 | $4,760 | $80,640 |
| 2020 | $4,444 | $70,840 | $3,780 | $67,060 |
| 2019 | $4,340 | $70,840 | $3,780 | $67,060 |
| 2018 | $4,479 | $70,840 | $3,780 | $67,060 |
| 2017 | $4,758 | $62,160 | $5,985 | $56,175 |
| 2016 | $4,691 | $177,600 | $17,100 | $160,500 |
| 2015 | $4,682 | $177,600 | $17,100 | $160,500 |
| 2014 | $4,193 | $59,750 | $5,740 | $54,010 |
| 2013 | $4,193 | $59,750 | $5,740 | $54,010 |
Source: Public Records
Map
Nearby Homes
- 7709 Fountain Dr
- 134 Deerfield Dr
- 7238 Lilac Ct
- 7909 Hill Ave
- 7256 Apache Trail
- 7944 Hill Ave
- 7920 N Shoreline Dr
- 8006 Cove Harbour Dr N
- 68 Hidden Meadow Dr
- 226 Perrine St
- 8046 Lea Ct
- 7331 Witherby Ct
- 217 Pebble Beach Dr
- 820 Weatherstone Rd
- 7111 Nebraska Ave
- 617 & 621 S Mccord Rd
- 508 Crystal Lake Dr
- 343 S Mccord Rd
- 1051 Wentworth St
- 427 S Mccord Rd
- 101 S King Rd
- 37 S King Rd
- 7608 Hidden Springs Dr
- 102 S King Rd
- 7627 Waterpoint Ct
- 27 S King Rd
- 7616 Hidden Springs Dr
- 7621 Waterpoint Ct
- 7607 Hidden Springs Dr
- 7633 Waterpoint Ct
- 7624 Hidden Springs Dr
- 7615 Waterpoint Ct
- 17 S King Rd
- 7615 Hidden Springs Dr
- 7639 Waterpoint Ct
- 7609 Waterpoint Ct
- 217 S King Rd
- 7632 Hidden Springs Dr
- 7623 Hidden Springs Dr
- 5 S King Rd