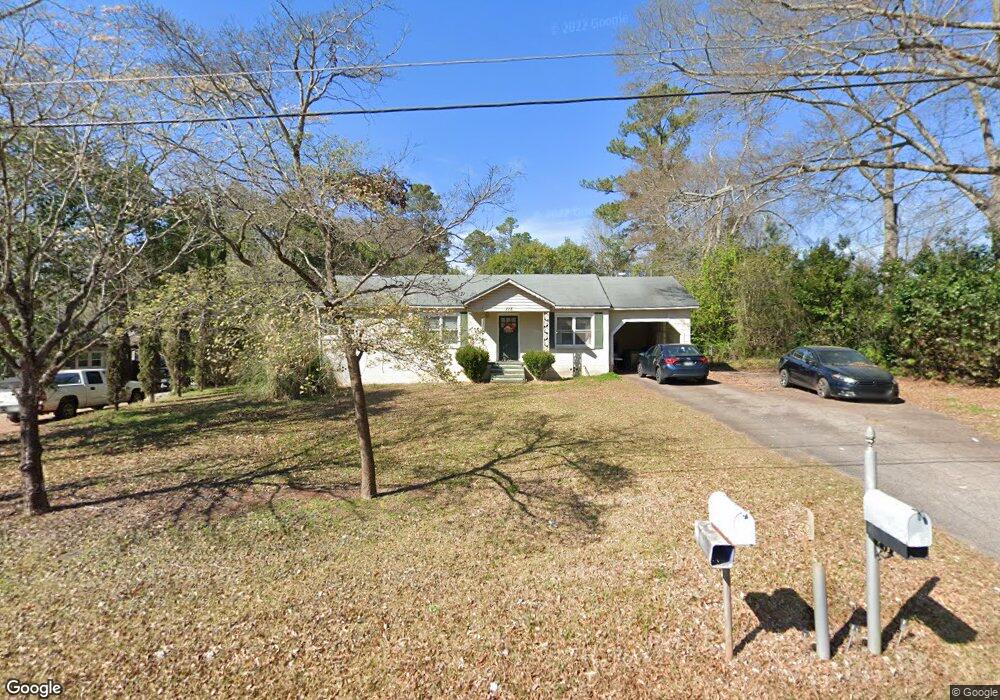
115 S Page St Lagrange, GA 30241
Estimated Value: $184,000 - $198,549
3
Beds
2
Baths
1,716
Sq Ft
$112/Sq Ft
Est. Value
About This Home
This home is located at 115 S Page St, Lagrange, GA 30241 and is currently estimated at $191,637, approximately $111 per square foot. 115 S Page St is a home located in Troup County with nearby schools including Franklin Forest Elementary School, Hollis Hand Elementary School, and Hillcrest Elementary School.
Ownership History
Date
Name
Owned For
Owner Type
Purchase Details
Closed on
Jun 17, 2005
Sold by
Prophett Jerry S
Bought by
Dunlap Martha W
Current Estimated Value
Home Financials for this Owner
Home Financials are based on the most recent Mortgage that was taken out on this home.
Original Mortgage
$65,000
Interest Rate
5.24%
Mortgage Type
New Conventional
Purchase Details
Closed on
Jun 21, 2004
Sold by
Federal National Mortgage
Bought by
Prophett Jerry S
Purchase Details
Closed on
Mar 3, 2004
Sold by
Regions Bank
Bought by
Federal National Mortgage
Purchase Details
Closed on
Mar 2, 2004
Sold by
Jennifer A Kennedy
Bought by
Regions Bank
Purchase Details
Closed on
Jul 12, 1995
Sold by
Dan-Ric Inc
Bought by
Jennifer A Kennedy
Purchase Details
Closed on
Mar 30, 1995
Sold by
Rodell Poole
Bought by
Dan-Ric Inc
Purchase Details
Closed on
Aug 1, 1985
Sold by
Wood T J
Bought by
Rodell Poole
Purchase Details
Closed on
Jan 1, 1953
Sold by
Charles Hambrick
Bought by
Wood T J
Create a Home Valuation Report for This Property
The Home Valuation Report is an in-depth analysis detailing your home's value as well as a comparison with similar homes in the area
Home Values in the Area
Average Home Value in this Area
Purchase History
| Date | Buyer | Sale Price | Title Company |
|---|---|---|---|
| Dunlap Martha W | $90,000 | -- | |
| Prophett Jerry S | -- | -- | |
| Federal National Mortgage | $59,500 | -- | |
| Regions Bank | $59,500 | -- | |
| Jennifer A Kennedy | $64,900 | -- | |
| Dan-Ric Inc | $62,400 | -- | |
| Rodell Poole | $45,000 | -- | |
| Wood T J | -- | -- |
Source: Public Records
Mortgage History
| Date | Status | Borrower | Loan Amount |
|---|---|---|---|
| Closed | Dunlap Martha W | $65,000 |
Source: Public Records
Tax History Compared to Growth
Tax History
| Year | Tax Paid | Tax Assessment Tax Assessment Total Assessment is a certain percentage of the fair market value that is determined by local assessors to be the total taxable value of land and additions on the property. | Land | Improvement |
|---|---|---|---|---|
| 2024 | $1,119 | $48,840 | $10,000 | $38,840 |
| 2023 | $1,048 | $46,240 | $10,000 | $36,240 |
| 2022 | $1,023 | $44,400 | $10,000 | $34,400 |
| 2021 | $745 | $32,456 | $8,000 | $24,456 |
| 2020 | $745 | $32,456 | $8,000 | $24,456 |
| 2019 | $653 | $29,392 | $4,120 | $25,272 |
| 2018 | $653 | $29,392 | $4,120 | $25,272 |
| 2017 | $653 | $29,392 | $4,120 | $25,272 |
| 2016 | $627 | $28,522 | $4,120 | $24,402 |
| 2015 | $627 | $28,522 | $4,120 | $24,402 |
| 2014 | $588 | $27,238 | $4,120 | $23,118 |
| 2013 | -- | $29,116 | $4,120 | $24,996 |
Source: Public Records
Map
Nearby Homes
- 134 S Page St
- 400 S Page St
- 114 Briarcliff Rd
- 806 New Franklin Rd
- 204 Colonial St
- 89 Chase Rd
- 107 Dixie Creek Dr
- 110 Russell St
- 106 S Chilton Crescent
- 100 Creekside Dr Unit LOT 60A
- 900 North St
- 519 Tradition Place
- 517 Tradition Place
- 129 Celebration Blvd
- 106 Ewing St
- 109 Dogwood Dr
- 102 Ewing St
- 724 Camellia Dr
- 117 Celebration Blvd
- 200 Crestwood Dr