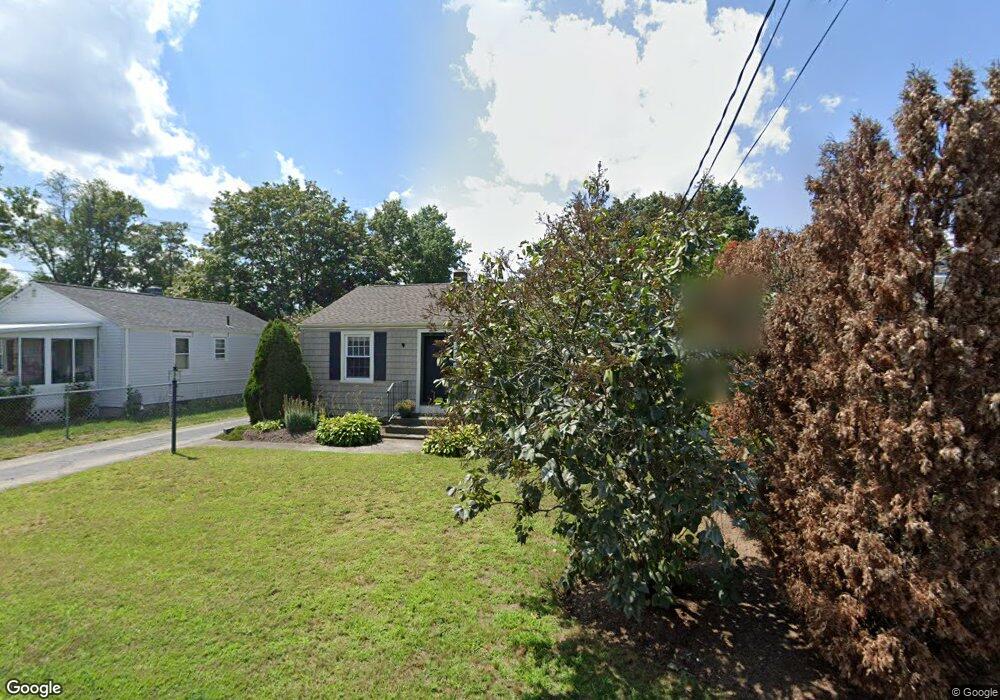
115 Sabin St Warwick, RI 02888
Spring Green NeighborhoodEstimated Value: $325,000 - $348,000
2
Beds
1
Bath
1,008
Sq Ft
$334/Sq Ft
Est. Value
About This Home
This home is located at 115 Sabin St, Warwick, RI 02888 and is currently estimated at $336,890, approximately $334 per square foot. 115 Sabin St is a home located in Kent County with nearby schools including St. Peter School and Saint Kevin School.
Ownership History
Date
Name
Owned For
Owner Type
Purchase Details
Closed on
Nov 23, 2009
Sold by
Shaw Pamela J
Bought by
Shaw Pamela J
Current Estimated Value
Purchase Details
Closed on
Nov 16, 1998
Sold by
Jones Royal C and Andreozzi Ann F
Bought by
Hart Pamela J
Home Financials for this Owner
Home Financials are based on the most recent Mortgage that was taken out on this home.
Original Mortgage
$75,000
Interest Rate
6.65%
Mortgage Type
Purchase Money Mortgage
Create a Home Valuation Report for This Property
The Home Valuation Report is an in-depth analysis detailing your home's value as well as a comparison with similar homes in the area
Home Values in the Area
Average Home Value in this Area
Purchase History
| Date | Buyer | Sale Price | Title Company |
|---|---|---|---|
| Shaw Pamela J | -- | -- | |
| Hart Pamela J | $85,000 | -- |
Source: Public Records
Mortgage History
| Date | Status | Borrower | Loan Amount |
|---|---|---|---|
| Open | Hart Pamela J | $96,000 | |
| Previous Owner | Hart Pamela J | $80,000 | |
| Previous Owner | Hart Pamela J | $75,000 |
Source: Public Records
Tax History
| Year | Tax Paid | Tax Assessment Tax Assessment Total Assessment is a certain percentage of the fair market value that is determined by local assessors to be the total taxable value of land and additions on the property. | Land | Improvement |
|---|---|---|---|---|
| 2025 | $3,959 | $311,700 | $105,500 | $206,200 |
| 2024 | $3,547 | $245,100 | $91,700 | $153,400 |
| 2023 | $3,478 | $245,100 | $91,700 | $153,400 |
| 2022 | $3,165 | $169,000 | $54,700 | $114,300 |
| 2021 | $3,165 | $169,000 | $54,700 | $114,300 |
| 2020 | $3,165 | $169,000 | $54,700 | $114,300 |
| 2019 | $3,165 | $169,000 | $54,700 | $114,300 |
| 2018 | $2,423 | $116,500 | $48,600 | $67,900 |
| 2017 | $2,358 | $116,500 | $48,600 | $67,900 |
| 2016 | $2,358 | $116,500 | $48,600 | $67,900 |
| 2015 | $2,202 | $106,100 | $53,200 | $52,900 |
| 2014 | $2,128 | $106,100 | $53,200 | $52,900 |
| 2013 | $2,100 | $106,100 | $53,200 | $52,900 |
Source: Public Records
Map
Nearby Homes
- 15 Christopher Rhodes Way
- 6 Christopher Rhodes Way
- 20 Commodore Ave
- 39 Holiday Ave
- 213 Easton Ave
- 52 Dahlia St
- 63 Benbridge Ave
- 1020 Warwick Ave
- 72 W Shore Rd Unit 3
- 33 Recess Ln
- 49 Recess Ln
- 14 Recess Ln
- 1052 Post Rd
- 821 Post Rd
- 56 Errol St
- 55 Dixie Ave
- 21 Sarah Ln
- 175 Pettaconsett Ave
- 80 Twin Oak Dr
- 80 George St
Your Personal Tour Guide
Ask me questions while you tour the home.