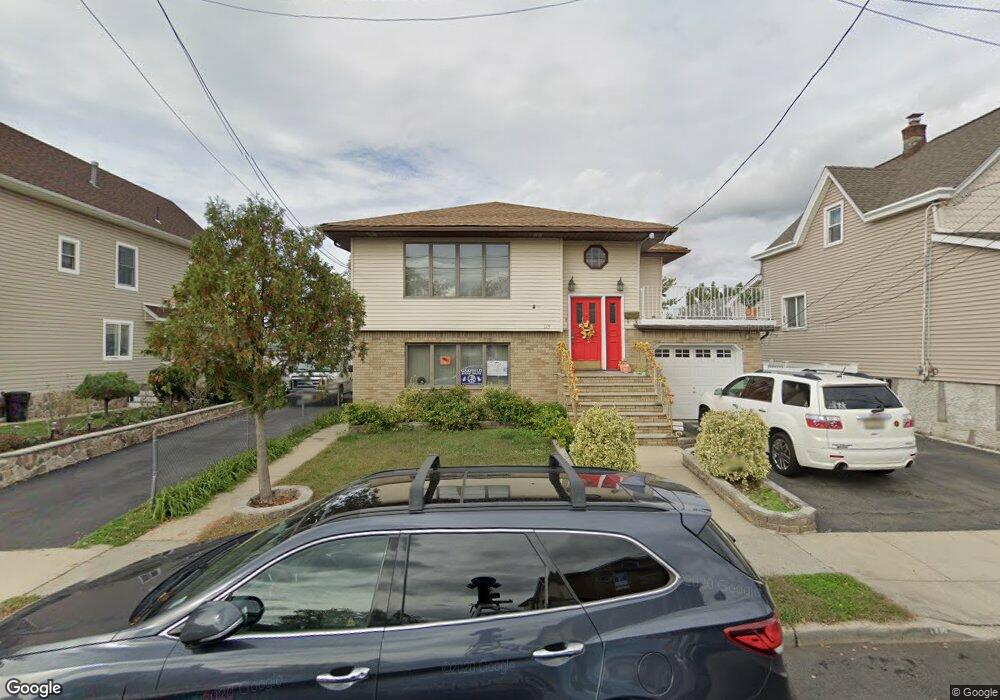
115 Sampson St Garfield, NJ 07026
Estimated Value: $779,412 - $1,061,000
6
Beds
4
Baths
2,914
Sq Ft
$321/Sq Ft
Est. Value
About This Home
This home is located at 115 Sampson St, Garfield, NJ 07026 and is currently estimated at $935,603, approximately $321 per square foot. 115 Sampson St is a home located in Bergen County with nearby schools including Garfield High School, Bergen Arts and Sciences Charter School, and Rainbow Montessori School - Clifton.
Ownership History
Date
Name
Owned For
Owner Type
Purchase Details
Closed on
Sep 6, 2024
Sold by
Naser Aysha and Naser Ahmad S
Bought by
Naser Ahmad S and Nasri Aysha
Current Estimated Value
Purchase Details
Closed on
Sep 22, 2011
Sold by
Anevski Naco and Anevski Voskra
Bought by
Naser Ahmad S and Naser Aysha
Home Financials for this Owner
Home Financials are based on the most recent Mortgage that was taken out on this home.
Original Mortgage
$340,000
Interest Rate
4.5%
Mortgage Type
FHA
Create a Home Valuation Report for This Property
The Home Valuation Report is an in-depth analysis detailing your home's value as well as a comparison with similar homes in the area
Home Values in the Area
Average Home Value in this Area
Purchase History
| Date | Buyer | Sale Price | Title Company |
|---|---|---|---|
| Naser Ahmad S | -- | Chicago Title | |
| Naser Ahmad S | -- | Chicago Title | |
| Naser Ahmad S | $395,000 | -- |
Source: Public Records
Mortgage History
| Date | Status | Borrower | Loan Amount |
|---|---|---|---|
| Previous Owner | Naser Ahmad S | $340,000 |
Source: Public Records
Tax History Compared to Growth
Tax History
| Year | Tax Paid | Tax Assessment Tax Assessment Total Assessment is a certain percentage of the fair market value that is determined by local assessors to be the total taxable value of land and additions on the property. | Land | Improvement |
|---|---|---|---|---|
| 2025 | $14,526 | $435,300 | $130,000 | $305,300 |
| 2024 | $14,282 | $435,300 | $130,000 | $305,300 |
| 2023 | $13,577 | $435,300 | $130,000 | $305,300 |
| 2022 | $13,577 | $435,300 | $130,000 | $305,300 |
| 2021 | $13,181 | $435,300 | $130,000 | $305,300 |
| 2020 | $12,894 | $435,300 | $130,000 | $305,300 |
| 2019 | $12,650 | $435,300 | $130,000 | $305,300 |
| 2018 | $12,367 | $435,300 | $130,000 | $305,300 |
| 2017 | $12,149 | $435,300 | $130,000 | $305,300 |
| 2016 | $11,788 | $435,300 | $130,000 | $305,300 |
| 2015 | $11,496 | $435,300 | $130,000 | $305,300 |
| 2014 | $11,192 | $435,300 | $130,000 | $305,300 |
Source: Public Records
Map
Nearby Homes
- 119 Dewey St
- 288 Outwater Ln
- 21 Pershing St
- 127 Union Ave
- 518 Palisade Ave
- 126 Plauderville Ave
- 25 Wood St
- 89 Plauderville Ave Unit 1
- 129 Hartmann Ave
- 93 Prospect St Unit 6
- 109 Morrell Place
- 64 Manner Ave
- 389 Semel Ave
- 2 Morrell Place
- 148 Semel Ave
- 70 Orchard St
- 50 Scudder St
- 51 Dewitt St
- 89 Morris Ave
- 167 Shaw St