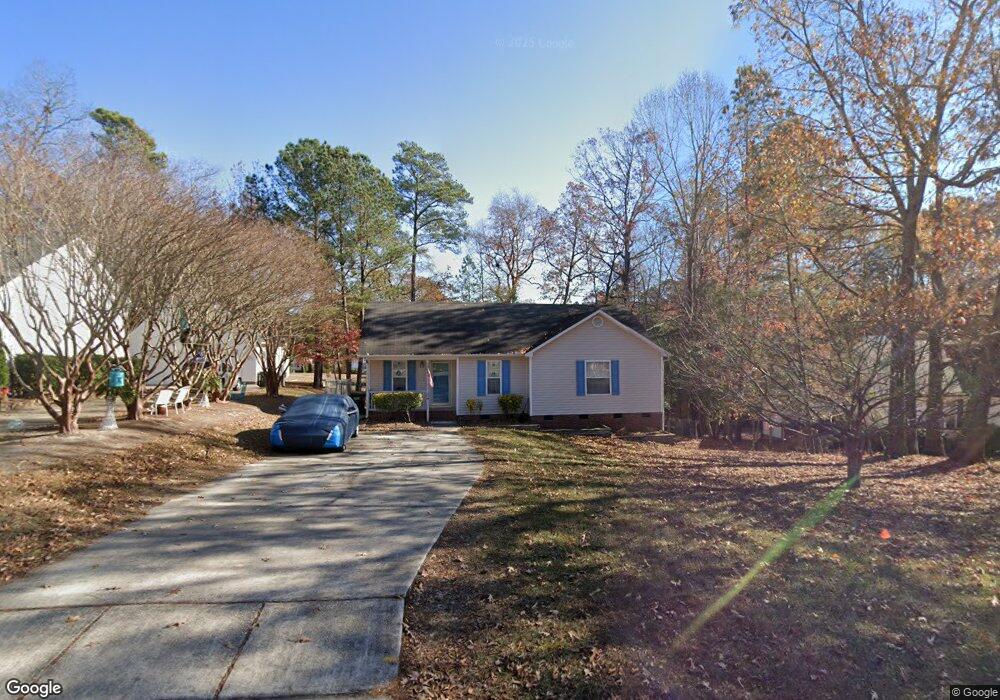
115 Ses Dr Clayton, NC 27520
Community Park NeighborhoodEstimated Value: $277,273 - $288,000
3
Beds
2
Baths
1,262
Sq Ft
$224/Sq Ft
Est. Value
About This Home
This home is located at 115 Ses Dr, Clayton, NC 27520 and is currently estimated at $283,318, approximately $224 per square foot. 115 Ses Dr is a home located in Johnston County with nearby schools including West Clayton Elementary School, Clayton Middle School, and Clayton High.
Ownership History
Date
Name
Owned For
Owner Type
Purchase Details
Closed on
May 18, 2025
Sold by
Raab Travis and Eggertsdottir Unnur
Bought by
Travis Raab Revocable Trust and Raab
Current Estimated Value
Purchase Details
Closed on
Nov 21, 2019
Sold by
Braswell Tammy S
Bought by
Raab Jerrold and Raab Travis
Home Financials for this Owner
Home Financials are based on the most recent Mortgage that was taken out on this home.
Original Mortgage
$138,000
Interest Rate
3.5%
Mortgage Type
New Conventional
Purchase Details
Closed on
Jul 15, 2005
Sold by
Hartman Lee Andrew
Bought by
Braswell Tammy S
Home Financials for this Owner
Home Financials are based on the most recent Mortgage that was taken out on this home.
Original Mortgage
$86,000
Interest Rate
6.54%
Mortgage Type
Assumption
Create a Home Valuation Report for This Property
The Home Valuation Report is an in-depth analysis detailing your home's value as well as a comparison with similar homes in the area
Home Values in the Area
Average Home Value in this Area
Purchase History
| Date | Buyer | Sale Price | Title Company |
|---|---|---|---|
| Travis Raab Revocable Trust | -- | None Listed On Document | |
| Travis Raab Revocable Trust | -- | None Listed On Document | |
| Raab Jerrold | $184,000 | None Available | |
| Braswell Tammy S | $107,500 | None Available |
Source: Public Records
Mortgage History
| Date | Status | Borrower | Loan Amount |
|---|---|---|---|
| Previous Owner | Raab Jerrold | $138,000 | |
| Previous Owner | Braswell Tammy S | $86,000 |
Source: Public Records
Tax History Compared to Growth
Tax History
| Year | Tax Paid | Tax Assessment Tax Assessment Total Assessment is a certain percentage of the fair market value that is determined by local assessors to be the total taxable value of land and additions on the property. | Land | Improvement |
|---|---|---|---|---|
| 2025 | $2,813 | $278,520 | $80,000 | $198,520 |
| 2024 | $2,074 | $157,090 | $52,000 | $105,090 |
| 2023 | $2,026 | $157,090 | $52,000 | $105,090 |
| 2022 | $2,089 | $157,090 | $52,000 | $105,090 |
| 2021 | $2,058 | $157,090 | $52,000 | $105,090 |
| 2020 | $2,105 | $157,090 | $52,000 | $105,090 |
| 2019 | $2,105 | $157,090 | $52,000 | $105,090 |
| 2018 | $1,752 | $128,840 | $34,000 | $94,840 |
| 2017 | $1,714 | $128,840 | $34,000 | $94,840 |
| 2016 | $1,714 | $128,840 | $34,000 | $94,840 |
| 2015 | $1,681 | $128,840 | $34,000 | $94,840 |
| 2014 | $1,681 | $128,840 | $34,000 | $94,840 |
Source: Public Records
Map
Nearby Homes
- 120 Ses Dr
- 200 Hocutt Dr
- 342 Durwin Ln
- 479 Winding Wood Dr
- 200 Waterford Dr
- 212 Wexford Dr
- 113 Sturbridge Dr Unit 113
- 129 Sturbridge Dr Unit 15
- 128 Glengariff Ln
- 1509 Kenmore Dr
- 316 Waterford Dr
- 34 Belhaven Dr
- 1812 Parkside Village Dr
- 215 W Moss Creek Dr
- 117 Butternut Ln
- 113 Butternut Ln
- 3069 Buttonwood Ln
- 1029 Cove Cir
- 2845 Bennington Dr
- 1261 Grovewood Dr