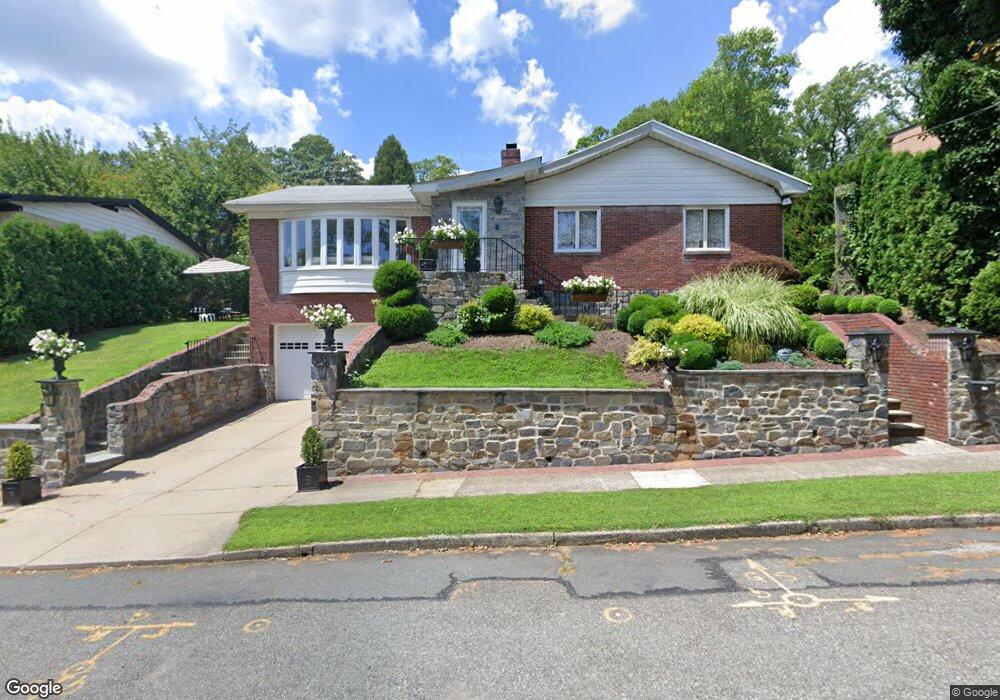
115 Signal Hill Rd Staten Island, NY 10301
Grymes Hill NeighborhoodEstimated Value: $835,811 - $1,021,000
3
Beds
2
Baths
1,340
Sq Ft
$699/Sq Ft
Est. Value
About This Home
This home is located at 115 Signal Hill Rd, Staten Island, NY 10301 and is currently estimated at $936,953, approximately $699 per square foot. 115 Signal Hill Rd is a home located in Richmond County with nearby schools including P.S. 35 The Clove Valley School, Intermediate School 27, and Curtis High School.
Ownership History
Date
Name
Owned For
Owner Type
Purchase Details
Closed on
May 20, 2008
Sold by
Altmann Betty Jane and Estate Of Vladimir Altmann
Bought by
Rohlin Julie Ann and Rohlin Todd C
Current Estimated Value
Home Financials for this Owner
Home Financials are based on the most recent Mortgage that was taken out on this home.
Original Mortgage
$616,500
Outstanding Balance
$395,098
Interest Rate
6.11%
Mortgage Type
Purchase Money Mortgage
Estimated Equity
$541,855
Create a Home Valuation Report for This Property
The Home Valuation Report is an in-depth analysis detailing your home's value as well as a comparison with similar homes in the area
Home Values in the Area
Average Home Value in this Area
Purchase History
| Date | Buyer | Sale Price | Title Company |
|---|---|---|---|
| Rohlin Julie Ann | $685,000 | None Available |
Source: Public Records
Mortgage History
| Date | Status | Borrower | Loan Amount |
|---|---|---|---|
| Open | Rohlin Julie Ann | $616,500 |
Source: Public Records
Tax History Compared to Growth
Tax History
| Year | Tax Paid | Tax Assessment Tax Assessment Total Assessment is a certain percentage of the fair market value that is determined by local assessors to be the total taxable value of land and additions on the property. | Land | Improvement |
|---|---|---|---|---|
| 2025 | $7,505 | $43,020 | $13,645 | $29,375 |
| 2024 | $7,505 | $45,900 | $12,065 | $33,835 |
| 2023 | $7,589 | $37,368 | $13,167 | $24,201 |
| 2022 | $7,404 | $39,480 | $14,820 | $24,660 |
| 2021 | $7,363 | $39,240 | $14,820 | $24,420 |
| 2020 | $6,987 | $33,840 | $14,820 | $19,020 |
| 2019 | $6,514 | $31,140 | $14,820 | $16,320 |
| 2018 | $6,485 | $33,274 | $13,859 | $19,415 |
| 2017 | $6,100 | $31,392 | $14,575 | $16,817 |
| 2016 | $5,966 | $31,392 | $12,608 | $18,784 |
| 2015 | $5,336 | $31,155 | $9,622 | $21,533 |
| 2014 | $5,336 | $29,392 | $10,890 | $18,502 |
Source: Public Records
Map
Nearby Homes
- 56 Park Ln
- 34 Claire Ct
- 88 Oakland Terrace
- 68 Signal Hill Rd
- 0 Woodside Ave
- 20 Signal Hill Rd
- 65 Cedarcliff Rd
- 802 van Duzer St
- 810 van Duzer St
- 806 van Duzer St
- 54 Cedarcliff Rd
- 50 Cedarcliff Rd
- 7 Osgood Ave
- 20 Tessa Ct
- 12 Laurel Ave
- 28 Maxie Ct
- 0 Hillside Ave
- 0 Howard Ave
- 346 Targee St
- 348 Targee St