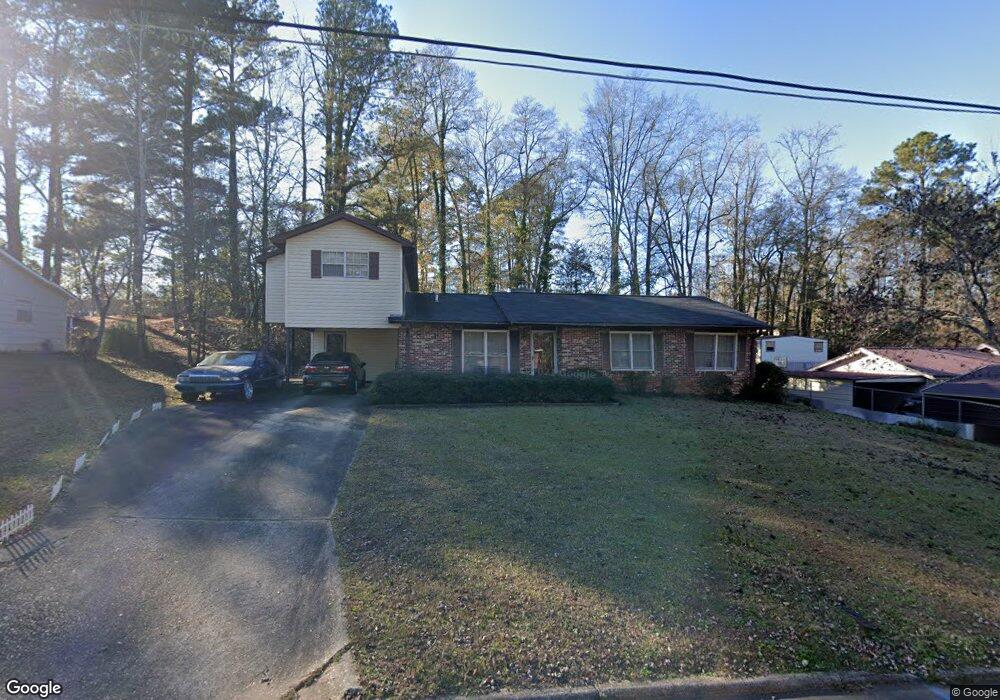
115 Sir Lancelot St Lagrange, GA 30241
Estimated Value: $226,000 - $343,000
5
Beds
4
Baths
2,566
Sq Ft
$104/Sq Ft
Est. Value
About This Home
This home is located at 115 Sir Lancelot St, Lagrange, GA 30241 and is currently estimated at $266,481, approximately $103 per square foot. 115 Sir Lancelot St is a home located in Troup County with nearby schools including Callaway Elementary School, Hogansville Elementary School, and Callaway Middle School.
Ownership History
Date
Name
Owned For
Owner Type
Purchase Details
Closed on
Jan 9, 2001
Sold by
Phyllis Stephens
Bought by
Selbie Frederic D and Selbie Joanna H
Current Estimated Value
Purchase Details
Closed on
Mar 13, 1997
Sold by
Selbie Fredrick
Bought by
Phyllis Stephens
Purchase Details
Closed on
Jan 10, 1997
Sold by
Selbie Fredrick
Bought by
Selbie Fredrick
Purchase Details
Closed on
May 3, 1983
Sold by
Va
Bought by
Selbie Fredrick
Purchase Details
Closed on
May 1, 1982
Sold by
Ware Henry L and Ware Mary J
Bought by
Va
Purchase Details
Closed on
Jan 1, 1977
Sold by
Yarbrough Tony and Yarbrough Belinda D
Bought by
Ware Henry L and Ware Mary J
Purchase Details
Closed on
Jan 1, 1971
Sold by
Camelot Builders Inc
Bought by
Yarbrough Tony and Yarbrough Belinda D
Purchase Details
Closed on
Oct 24, 1968
Sold by
Mrs J T Whitaker
Bought by
Camelot Builders Inc
Create a Home Valuation Report for This Property
The Home Valuation Report is an in-depth analysis detailing your home's value as well as a comparison with similar homes in the area
Home Values in the Area
Average Home Value in this Area
Purchase History
| Date | Buyer | Sale Price | Title Company |
|---|---|---|---|
| Selbie Frederic D | -- | -- | |
| Phyllis Stephens | -- | -- | |
| Selbie Fredrick | $55,000 | -- | |
| Selbie Fredrick | -- | -- | |
| Va | -- | -- | |
| Ware Henry L | -- | -- | |
| Yarbrough Tony | -- | -- | |
| Camelot Builders Inc | -- | -- |
Source: Public Records
Tax History Compared to Growth
Tax History
| Year | Tax Paid | Tax Assessment Tax Assessment Total Assessment is a certain percentage of the fair market value that is determined by local assessors to be the total taxable value of land and additions on the property. | Land | Improvement |
|---|---|---|---|---|
| 2024 | $2,193 | $80,416 | $10,000 | $70,416 |
| 2023 | $1,995 | $73,160 | $10,000 | $63,160 |
| 2022 | $1,690 | $60,560 | $5,320 | $55,240 |
| 2021 | $1,502 | $49,792 | $4,440 | $45,352 |
| 2020 | $1,502 | $49,792 | $4,440 | $45,352 |
| 2019 | $1,392 | $46,160 | $4,440 | $41,720 |
| 2018 | $1,392 | $46,160 | $4,440 | $41,720 |
| 2017 | $1,392 | $46,160 | $4,440 | $41,720 |
| 2016 | $1,349 | $44,732 | $4,450 | $40,282 |
| 2015 | $1,351 | $44,732 | $4,450 | $40,282 |
| 2014 | $1,289 | $42,612 | $4,450 | $38,162 |
| 2013 | -- | $43,104 | $4,450 | $38,654 |
Source: Public Records
Map
Nearby Homes
- 456 Brookstone Dr
- 719 Windstream Dr Unit B61
- 719 Windstream Dr
- 721 Windstream Dr Unit B62
- 113 Woodridge Cir
- 124 Shenandoah Ln
- Hemingway Plan at Crossvine Village
- Mira Plan at Crossvine Village
- Cecil Plan at Crossvine Village
- Tucker FP Plan at Crossvine Village
- Sierra Plan at Crossvine Village
- Jodeco FP Plan at Crossvine Village
- Nottely Plan at Crossvine Village
- Carter Plan at Crossvine Village
- Winston Plan at Crossvine Village
- Nelson Plan at Crossvine Village
- Madison Plan at Crossvine Village
- 206 Freshwater Ct Unit 34E
- 206 Freshwater Ct
- 128 Shenandoah Ln Unit A67
- 117 Sir Lancelot St
- 113 Sir Lancelot St
- 111 Sir Lancelot St
- 210 Whitaker St
- 119 Sir Lancelot St
- 114 Sir Lancelot St
- 112 Sir Lancelot St
- 116 Sir Lancelot St
- 214 Whitaker St
- 110 Sir Lancelot St
- 212 Whitaker St
- 0 Sir Lancelot St Unit 3156965
- 109 Sir Lancelot St
- 118 Sir Lancelot St
- 211 Whitaker St
- 108 Sir Lancelot St
- 124 Whitaker St
- 213 Whitaker St
- 121 King Arthur Dr
- 107 Sir Lancelot St