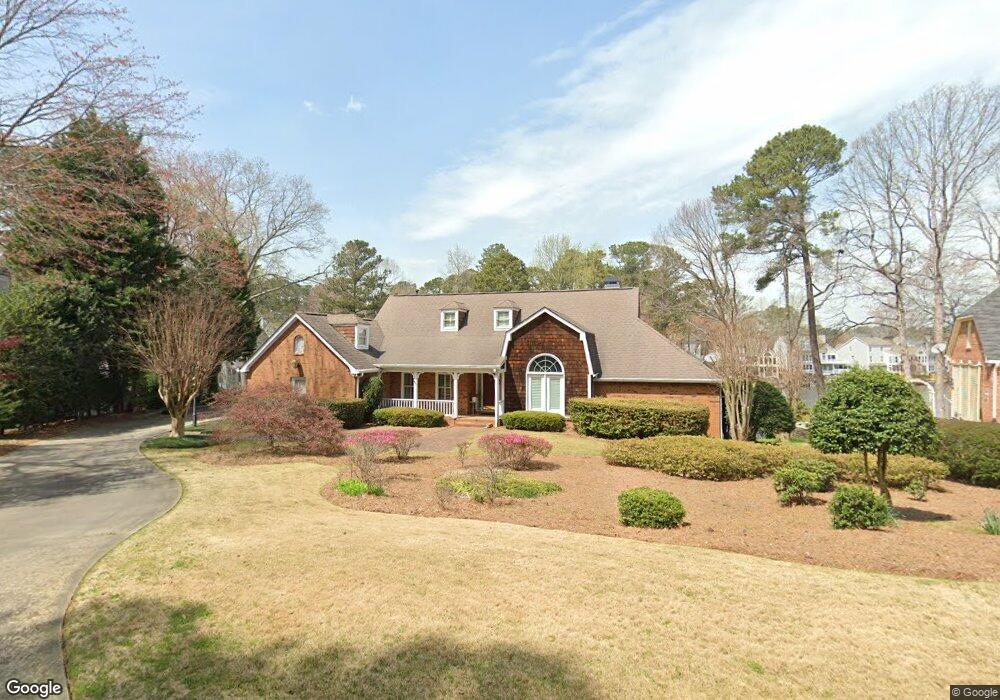
115 Staghound Ct Unit 4 Alpharetta, GA 30005
Windward NeighborhoodEstimated Value: $909,000 - $2,022,000
5
Beds
4
Baths
2,731
Sq Ft
$554/Sq Ft
Est. Value
About This Home
This home is located at 115 Staghound Ct Unit 4, Alpharetta, GA 30005 and is currently estimated at $1,512,655, approximately $553 per square foot. 115 Staghound Ct Unit 4 is a home located in Fulton County with nearby schools including Creek View Elementary School, Webb Bridge Middle School, and Alpharetta High School.
Ownership History
Date
Name
Owned For
Owner Type
Purchase Details
Closed on
May 16, 2012
Sold by
Lie-Nielsen John
Bought by
Chan Kwok Hing and Chan Pik Fung
Current Estimated Value
Home Financials for this Owner
Home Financials are based on the most recent Mortgage that was taken out on this home.
Original Mortgage
$417,000
Outstanding Balance
$288,918
Interest Rate
3.9%
Mortgage Type
New Conventional
Estimated Equity
$1,223,737
Purchase Details
Closed on
Oct 1, 2007
Sold by
Montanaro Susan A
Bought by
Lie-Nielsen John and Lie-Nielsen Debra
Purchase Details
Closed on
Feb 25, 2005
Sold by
Baker David H and Baker Ruth
Bought by
Montanaro Susan A
Home Financials for this Owner
Home Financials are based on the most recent Mortgage that was taken out on this home.
Original Mortgage
$60,000
Interest Rate
5.6%
Mortgage Type
Stand Alone Refi Refinance Of Original Loan
Create a Home Valuation Report for This Property
The Home Valuation Report is an in-depth analysis detailing your home's value as well as a comparison with similar homes in the area
Home Values in the Area
Average Home Value in this Area
Purchase History
| Date | Buyer | Sale Price | Title Company |
|---|---|---|---|
| Chan Kwok Hing | $650,000 | -- | |
| Lie-Nielsen John | $751,800 | -- | |
| Montanaro Susan A | $600,000 | -- |
Source: Public Records
Mortgage History
| Date | Status | Borrower | Loan Amount |
|---|---|---|---|
| Open | Chan Kwok Hing | $417,000 | |
| Previous Owner | Montanaro Susan A | $60,000 |
Source: Public Records
Tax History Compared to Growth
Tax History
| Year | Tax Paid | Tax Assessment Tax Assessment Total Assessment is a certain percentage of the fair market value that is determined by local assessors to be the total taxable value of land and additions on the property. | Land | Improvement |
|---|---|---|---|---|
| 2025 | $3,287 | $640,480 | $307,720 | $332,760 |
| 2023 | $3,287 | $412,920 | $171,080 | $241,840 |
| 2022 | $10,864 | $412,920 | $171,080 | $241,840 |
| 2021 | $12,330 | $375,000 | $155,760 | $219,240 |
| 2020 | $8,233 | $393,920 | $186,160 | $207,760 |
| 2019 | $1,411 | $359,640 | $166,320 | $193,320 |
| 2018 | $6,928 | $245,440 | $56,640 | $188,800 |
| 2017 | $7,278 | $249,440 | $98,560 | $150,880 |
| 2016 | $7,279 | $249,440 | $98,560 | $150,880 |
| 2015 | $8,743 | $249,440 | $98,560 | $150,880 |
| 2014 | $6,041 | $197,080 | $77,880 | $119,200 |
Source: Public Records
Map
Nearby Homes
- 1605 Spinnaker Dr
- 1585 Spinnaker Dr
- 515 Martha Way
- 410 Red Jacket Way
- 222 Mossy Place
- 2195 Lake Shore Landing
- 6165 Pin Oak Ln
- 520 Flying Scot Way
- 6105 Harbour Overlook
- 8110 Willow Tree Way
- 4440 Webb Bridge Rd
- 535 Tumbling Creek Dr Unit 6
- 1140 Park Glenn Dr
- 1225 Bay Pointe Terrace
- 1200 Bay Pointe Terrace
- 1620 Silverleaf Way
- 10 Club Ct
- 2800 Lakewind Ct
- 1075 Carnoustie Ln
- 2040 Whitestone Place Unit 71
- 115 Staghound Ct
- 105 Staghound Ct
- 125 Staghound Ct
- 3701 Spinnaker Cir
- 111 Clipper Bay Dr
- 3721 Spinnaker Cir
- 135 Staghound Ct
- 0 Spinnaker Dr Unit 7496433
- 0 Spinnaker Dr Unit 7263765
- 0 Spinnaker Dr Unit 7235397
- 0 Spinnaker Dr Unit 7124533
- 0 Spinnaker Dr Unit 8562079
- 131 Clipper Bay Dr
- 105 Clipper Bay Dr
- 145 Staghound Ct
- 3731 Spinnaker Cir
- 1530 Spinnaker Dr
- 3730 Spinnaker Cir
- 1555 Spinnaker Dr
- 141 Clipper Bay Dr