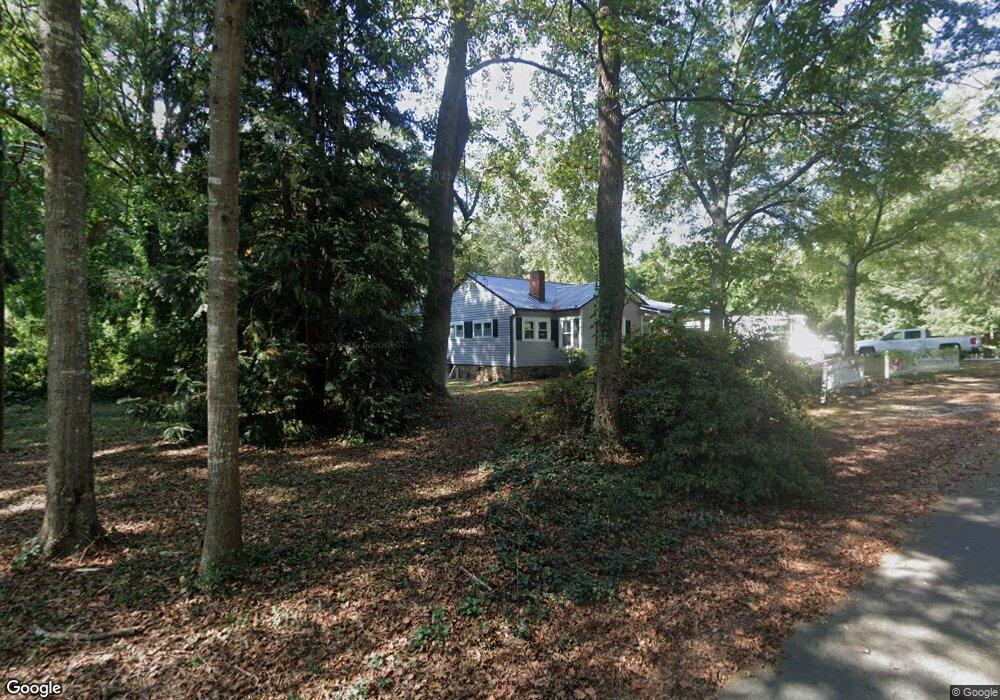
115 Third St Bowdon, GA 30108
Estimated Value: $250,000 - $315,000
3
Beds
2
Baths
1,992
Sq Ft
$146/Sq Ft
Est. Value
About This Home
This home is located at 115 Third St, Bowdon, GA 30108 and is currently estimated at $290,797, approximately $145 per square foot. 115 Third St is a home located in Carroll County with nearby schools including Bowdon Elementary School, Bowdon Middle School, and Bowdon High School.
Ownership History
Date
Name
Owned For
Owner Type
Purchase Details
Closed on
Jan 3, 2024
Sold by
West Jack E
Bought by
Morton Candice Felicia and Morton Chad Russell
Current Estimated Value
Purchase Details
Closed on
Oct 18, 2022
Sold by
Oml Properties Llc
Bought by
West Jack E and West Karen P
Purchase Details
Closed on
Jul 12, 2010
Sold by
West Jack Emmett
Bought by
Oml Properties
Purchase Details
Closed on
Jan 26, 2009
Sold by
West Mary H Of
Bought by
West Jack E
Purchase Details
Closed on
Jan 12, 2004
Sold by
West Mary H
Bought by
West Mary H
Purchase Details
Closed on
Feb 19, 1988
Bought by
West Mary H
Create a Home Valuation Report for This Property
The Home Valuation Report is an in-depth analysis detailing your home's value as well as a comparison with similar homes in the area
Home Values in the Area
Average Home Value in this Area
Purchase History
| Date | Buyer | Sale Price | Title Company |
|---|---|---|---|
| Morton Candice Felicia | $109,900 | -- | |
| West Jack E | -- | -- | |
| Oml Properties | -- | -- | |
| West Jack E | -- | -- | |
| West Mary H | -- | -- | |
| West Mary H | -- | -- |
Source: Public Records
Tax History
| Year | Tax Paid | Tax Assessment Tax Assessment Total Assessment is a certain percentage of the fair market value that is determined by local assessors to be the total taxable value of land and additions on the property. | Land | Improvement |
|---|---|---|---|---|
| 2025 | $1,271 | $114,736 | $35,391 | $79,345 |
| 2024 | $1,293 | $114,736 | $35,391 | $79,345 |
| 2023 | $1,293 | $122,684 | $50,268 | $72,416 |
| 2022 | $2,879 | $88,907 | $33,512 | $55,395 |
| 2021 | $2,477 | $74,282 | $26,810 | $47,472 |
| 2020 | $2,248 | $66,894 | $24,372 | $42,522 |
| 2019 | $2,132 | $62,550 | $24,372 | $38,178 |
| 2018 | $1,411 | $40,496 | $18,906 | $21,590 |
| 2017 | $1,414 | $40,496 | $18,906 | $21,590 |
| 2016 | $1,414 | $40,496 | $18,906 | $21,590 |
| 2015 | $1,531 | $41,878 | $20,056 | $21,822 |
| 2014 | $1,539 | $41,879 | $20,056 | $21,822 |
Source: Public Records
Map
Nearby Homes
- 301 Angela Ave Unit 8
- 301 Angela Ave
- 309 Angela Ave
- 309 Angela Ave Unit 6
- 110 Bartlett Cir
- 263 Eason St Unit 12
- 263 Eason St
- 267 Eason St
- 267 Eason St Unit 13
- 255 Eason St Unit 10
- 255 Eason St
- 0 Bartlett Cir Unit 10666514
- 714 Yates Rd
- 0 W Highway 166 Unit 10700336
- 0 W Highway 166 Unit 150705
- 0 W Highway 166 Unit 148352
- 313 Ellenwood Dr
- 310 W College St
- 479 West Ave
- 485 West Ave
- 106 Third St
- 1020 W College St
- 914 Harris Ave
- 914 Harris Ave
- 0 Harris Ave
- 918 W College St
- 209 Second St
- 905 Harris Ave
- 912 W College St
- 906 W College St
- 2nd 2nd St
- 0 2nd St
- 217 Second St
- 1026 W College St
- 900 W College St
- 210 2nd St
- 100 Forest Hill Rd
- 210 Second St
- 832 Highway 166 E
- 1036 W College St
Your Personal Tour Guide
Ask me questions while you tour the home.