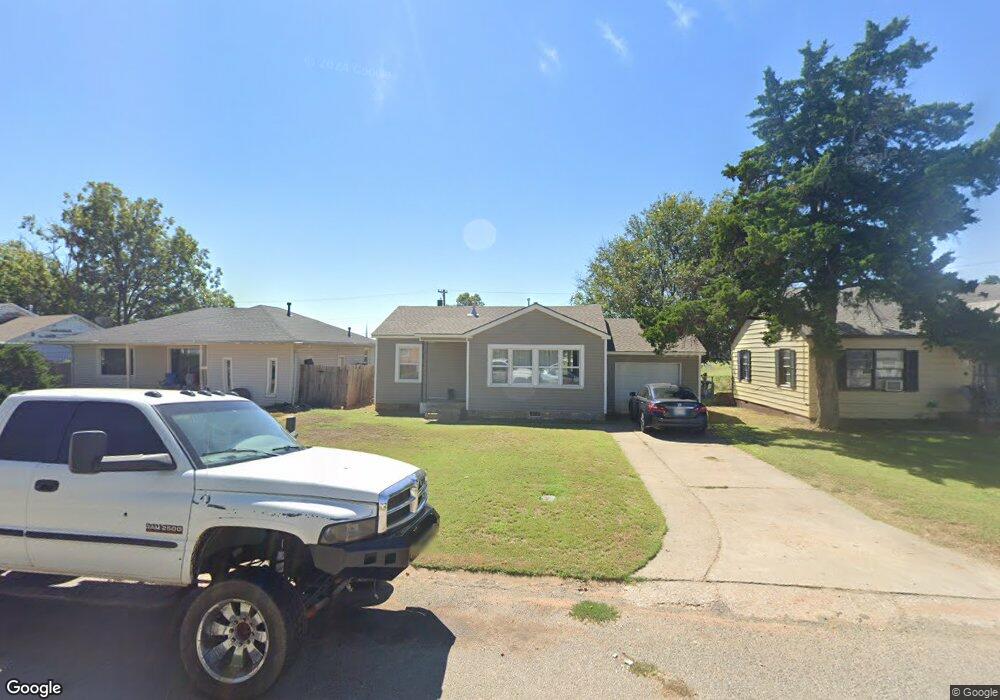
115 Thornton Ln Elk City, OK 73644
Estimated Value: $95,000 - $126,000
2
Beds
1
Bath
1,074
Sq Ft
$107/Sq Ft
Est. Value
About This Home
This home is located at 115 Thornton Ln, Elk City, OK 73644 and is currently estimated at $114,527, approximately $106 per square foot. 115 Thornton Ln is a home located in Beckham County with nearby schools including Elk City Elementary School, Elk City IES, and Elk City Middle School.
Ownership History
Date
Name
Owned For
Owner Type
Purchase Details
Closed on
May 25, 2016
Sold by
Lira Hilario
Bought by
Reyes Maria Roberta
Current Estimated Value
Purchase Details
Closed on
May 11, 2007
Sold by
Armstrong Christopher R and Armstrong Tomara
Bought by
Liara Hilario and Lira Maria Roberta
Home Financials for this Owner
Home Financials are based on the most recent Mortgage that was taken out on this home.
Original Mortgage
$76,396
Outstanding Balance
$46,216
Interest Rate
6.16%
Mortgage Type
FHA
Estimated Equity
$68,311
Purchase Details
Closed on
Aug 22, 2002
Sold by
Beck
Bought by
Armstrong
Purchase Details
Closed on
Aug 4, 2000
Sold by
Drake Drake and Drake Bryant
Bought by
Beck
Purchase Details
Closed on
Nov 11, 1999
Sold by
Watkins
Bought by
Drake Jill and Drake Bryant J
Purchase Details
Closed on
Sep 23, 1994
Sold by
Drake
Bought by
Watkins
Create a Home Valuation Report for This Property
The Home Valuation Report is an in-depth analysis detailing your home's value as well as a comparison with similar homes in the area
Home Values in the Area
Average Home Value in this Area
Purchase History
| Date | Buyer | Sale Price | Title Company |
|---|---|---|---|
| Reyes Maria Roberta | -- | None Available | |
| Liara Hilario | $77,000 | None Available | |
| Armstrong | $43,500 | -- | |
| Beck | $18,000 | -- | |
| Drake Jill | -- | -- | |
| Watkins | $19,000 | -- |
Source: Public Records
Mortgage History
| Date | Status | Borrower | Loan Amount |
|---|---|---|---|
| Open | Liara Hilario | $76,396 |
Source: Public Records
Tax History Compared to Growth
Tax History
| Year | Tax Paid | Tax Assessment Tax Assessment Total Assessment is a certain percentage of the fair market value that is determined by local assessors to be the total taxable value of land and additions on the property. | Land | Improvement |
|---|---|---|---|---|
| 2025 | $1,123 | $12,113 | $624 | $11,489 |
| 2024 | $1,123 | $12,113 | $624 | $11,489 |
| 2023 | $1,124 | $12,113 | $624 | $11,489 |
| 2022 | $1,070 | $12,113 | $624 | $11,489 |
| 2021 | $1,069 | $12,113 | $624 | $11,489 |
| 2020 | $1,070 | $12,113 | $624 | $11,489 |
| 2019 | $1,060 | $12,113 | $624 | $11,489 |
| 2018 | $1,070 | $12,113 | $624 | $11,489 |
| 2017 | $1,045 | $11,843 | $605 | $11,238 |
| 2016 | $961 | $11,279 | $605 | $10,674 |
| 2015 | $759 | $10,742 | $605 | $10,137 |
| 2014 | $723 | $10,231 | $605 | $9,626 |
Source: Public Records
Map
Nearby Homes
- 124 Thornton Ln
- 1219 Crestview Dr
- 203 Hayden Blvd
- 116 Currell Ln
- 1123 Bedford Dr
- 161 Blackburn Blvd
- 1025 N Adams Ave
- 401 Mcarthur Blvd
- 402 Mcarthur Blvd
- 0 Bullard Dr
- 1523 N Washington Ave
- 1101 Colorado Ave
- 220 Hoover Cir
- 00 N 00 Main St
- 101 Rowsey Rd
- 621 N Adams Ave
- 602 N Main St
- 321 W B Ave
- 805 Shore Dr
- 424 N Madison Ave
- 113 Thornton Ln
- 117 Thornton Ln
- 111 Thornton Ln
- 119 Thornton Ln
- 109 Thornton Ln
- 121 Thornton Ln
- 120 Thornton Ln
- 122 Thornton Ln
- 118 Thornton Ln
- 107 Thornton Ln
- 116 Thornton Ln
- 123 Thornton Ln
- 126 Thornton Ln
- 114 Thornton Ln
- 131 Thornton Ln
- 105 Thornton Ln
- 112 Thornton Ln
- 136 Herring Dr
- 121 Carpenter Ln
- 103 Thornton Ln