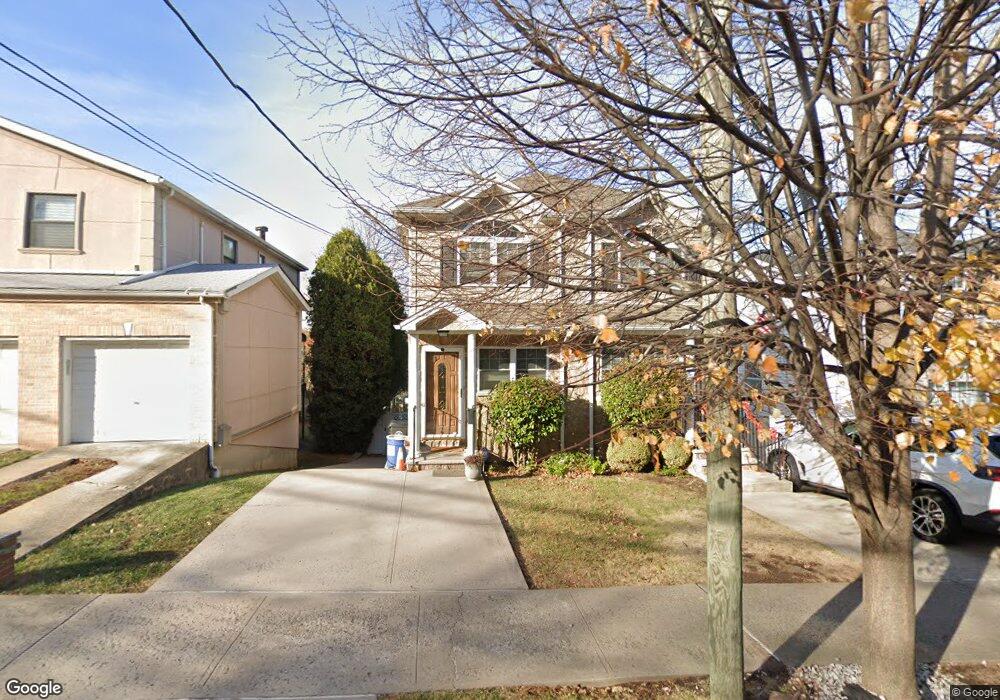
115 Tioga St Unit A Staten Island, NY 10301
Sunnyside NeighborhoodEstimated Value: $726,000 - $797,000
3
Beds
3
Baths
1,200
Sq Ft
$628/Sq Ft
Est. Value
About This Home
This home is located at 115 Tioga St Unit A, Staten Island, NY 10301 and is currently estimated at $753,172, approximately $627 per square foot. 115 Tioga St Unit A is a home located in Richmond County with nearby schools including P.S. 35 The Clove Valley School, Intermediate School 27, and Curtis High School.
Ownership History
Date
Name
Owned For
Owner Type
Purchase Details
Closed on
Dec 20, 2010
Sold by
Formica Construction Inc
Bought by
Gonzalez Naomi
Current Estimated Value
Home Financials for this Owner
Home Financials are based on the most recent Mortgage that was taken out on this home.
Original Mortgage
$387,845
Outstanding Balance
$246,695
Interest Rate
3.5%
Mortgage Type
FHA
Estimated Equity
$506,477
Purchase Details
Closed on
Jan 28, 2009
Sold by
Doni Ruth L
Bought by
Formica Construction Inc
Create a Home Valuation Report for This Property
The Home Valuation Report is an in-depth analysis detailing your home's value as well as a comparison with similar homes in the area
Home Values in the Area
Average Home Value in this Area
Purchase History
| Date | Buyer | Sale Price | Title Company |
|---|---|---|---|
| Gonzalez Naomi | $395,000 | None Available | |
| Formica Construction Inc | $200,000 | None Available |
Source: Public Records
Mortgage History
| Date | Status | Borrower | Loan Amount |
|---|---|---|---|
| Open | Gonzalez Naomi | $387,845 |
Source: Public Records
Tax History Compared to Growth
Tax History
| Year | Tax Paid | Tax Assessment Tax Assessment Total Assessment is a certain percentage of the fair market value that is determined by local assessors to be the total taxable value of land and additions on the property. | Land | Improvement |
|---|---|---|---|---|
| 2025 | $6,695 | $41,820 | $6,233 | $35,587 |
| 2024 | $6,707 | $37,920 | $6,595 | $31,325 |
| 2023 | $6,599 | $33,895 | $5,990 | $27,905 |
| 2022 | $6,097 | $36,720 | $7,200 | $29,520 |
| 2021 | $6,046 | $34,500 | $7,200 | $27,300 |
| 2020 | $6,090 | $37,440 | $7,200 | $30,240 |
| 2019 | $5,853 | $36,060 | $7,200 | $28,860 |
| 2018 | $5,460 | $28,246 | $6,096 | $22,150 |
| 2017 | $5,133 | $26,648 | $6,246 | $20,402 |
| 2016 | $4,716 | $25,140 | $7,200 | $17,940 |
| 2015 | $4,629 | $25,560 | $6,240 | $19,320 |
| 2014 | $4,629 | $24,120 | $6,240 | $17,880 |
Source: Public Records
Map
Nearby Homes