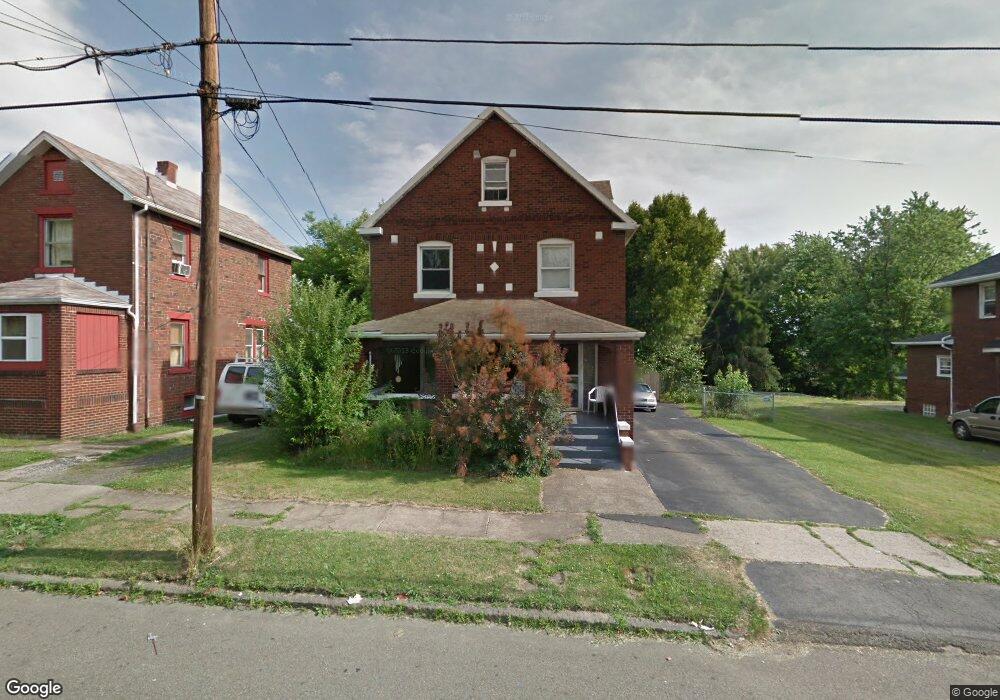
115 Tremble Ave Campbell, OH 44405
Estimated Value: $50,000 - $92,376
3
Beds
1
Bath
1,555
Sq Ft
$49/Sq Ft
Est. Value
About This Home
This home is located at 115 Tremble Ave, Campbell, OH 44405 and is currently estimated at $76,094, approximately $48 per square foot. 115 Tremble Ave is a home located in Mahoning County with nearby schools including Campbell Elementary School, Memorial High School, and Northeast Ohio Impact Academy.
Ownership History
Date
Name
Owned For
Owner Type
Purchase Details
Closed on
Nov 2, 2005
Sold by
Hud
Bought by
Clark Brock D
Current Estimated Value
Home Financials for this Owner
Home Financials are based on the most recent Mortgage that was taken out on this home.
Original Mortgage
$30,224
Outstanding Balance
$16,062
Interest Rate
6.04%
Mortgage Type
Fannie Mae Freddie Mac
Estimated Equity
$60,032
Purchase Details
Closed on
Dec 9, 2004
Sold by
Flores Joseph R
Bought by
Hud
Purchase Details
Closed on
May 30, 1996
Sold by
Igo Margaret
Bought by
Flores Joseph R
Home Financials for this Owner
Home Financials are based on the most recent Mortgage that was taken out on this home.
Original Mortgage
$26,252
Interest Rate
7.99%
Mortgage Type
FHA
Purchase Details
Closed on
Jan 2, 1996
Sold by
Allinos Sandra
Bought by
Igo Philip C and Igo Margaret
Purchase Details
Closed on
Sep 29, 1978
Bought by
Allinos Sandra
Create a Home Valuation Report for This Property
The Home Valuation Report is an in-depth analysis detailing your home's value as well as a comparison with similar homes in the area
Home Values in the Area
Average Home Value in this Area
Purchase History
| Date | Buyer | Sale Price | Title Company |
|---|---|---|---|
| Clark Brock D | $33,583 | Lakeside Title & Escrow Agen | |
| Hud | $16,000 | -- | |
| Flores Joseph R | $26,000 | -- | |
| Igo Philip C | $15,000 | -- | |
| Allinos Sandra | -- | -- |
Source: Public Records
Mortgage History
| Date | Status | Borrower | Loan Amount |
|---|---|---|---|
| Open | Clark Brock D | $30,224 | |
| Previous Owner | Flores Joseph R | $26,252 |
Source: Public Records
Tax History
| Year | Tax Paid | Tax Assessment Tax Assessment Total Assessment is a certain percentage of the fair market value that is determined by local assessors to be the total taxable value of land and additions on the property. | Land | Improvement |
|---|---|---|---|---|
| 2025 | $2,073 | $16,620 | $1,560 | $15,060 |
| 2024 | $1,802 | $16,620 | $1,560 | $15,060 |
| 2023 | $883 | $16,620 | $1,560 | $15,060 |
| 2022 | $745 | $11,730 | $1,420 | $10,310 |
| 2021 | $699 | $11,730 | $1,420 | $10,310 |
| 2020 | $710 | $11,730 | $1,420 | $10,310 |
| 2019 | $753 | $11,070 | $1,340 | $9,730 |
| 2018 | $772 | $11,070 | $1,340 | $9,730 |
| 2017 | $790 | $11,070 | $1,340 | $9,730 |
| 2016 | $811 | $12,400 | $1,580 | $10,820 |
| 2015 | $795 | $12,400 | $1,580 | $10,820 |
| 2014 | $793 | $12,400 | $1,580 | $10,820 |
| 2013 | $778 | $12,400 | $1,580 | $10,820 |
Source: Public Records
Map
Nearby Homes
- 204 Tremble Ave
- 459 Tenney Ave
- 130 12th St
- 0 Penhale Ave
- 374 Tenney Ave
- 664 Tenney Ave
- 151 Regent St
- 190 10th St
- 412 Whipple Ave
- 121 Princess St
- 159 Piccadilly St
- 165 Piccadilly St
- 114 Penhale Ave
- 330 Sanderson Ave
- 611 Matawan Dr
- 291 Struthers Liberty Rd
- 97 Rosary Dr
- 321 Porter Ave
- 541 Blossom Ave
- 3307 Upland Ave
- 119 Tremble Ave
- 109 Tremble Ave
- 123 Tremble Ave
- 105 Tremble Ave
- 127 Tremble Ave
- 99 Tremble Ave
- 180 Gordon Ave
- 176 Gordon Ave
- 114 Tremble Ave
- 112 Tremble Ave
- 120 Tremble Ave
- 174 Gordon Ave
- 91 Tremble Ave
- 124 Tremble Ave
- 104 Tremble Ave
- 100 Tremble Ave
- 192 Gordon Ave
- 128 Tremble Ave
- 168 Gordon Ave
- 188 Gordon Ave
Your Personal Tour Guide
Ask me questions while you tour the home.