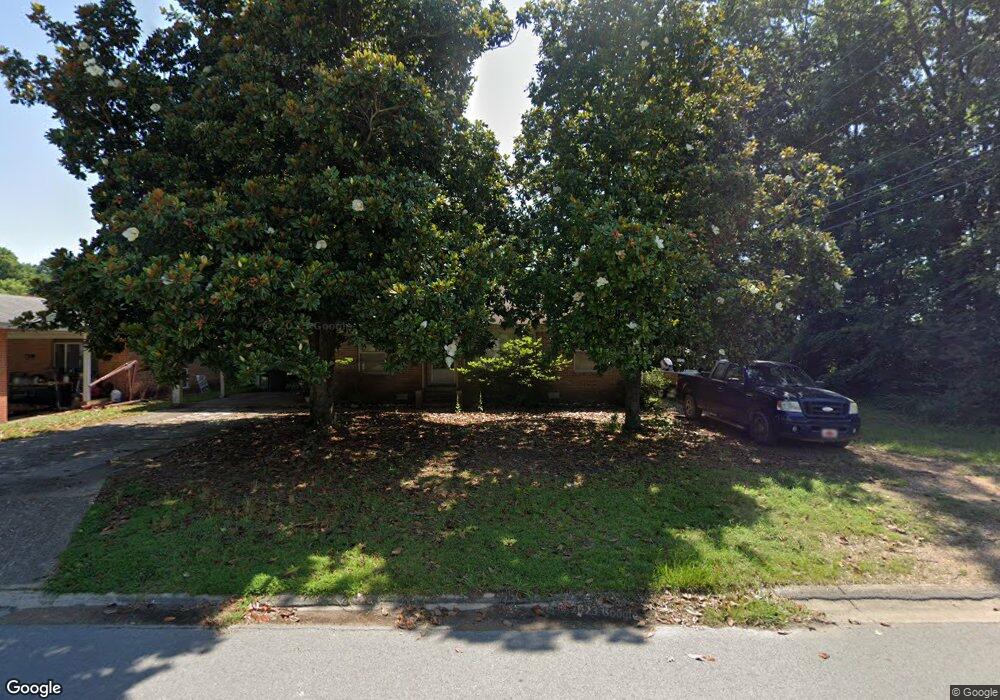
115 Troutt Benton, AR 72019
Estimated Value: $146,000 - $169,320
Studio
2
Baths
1,546
Sq Ft
$101/Sq Ft
Est. Value
About This Home
This home is located at 115 Troutt, Benton, AR 72019 and is currently estimated at $156,830, approximately $101 per square foot. 115 Troutt is a home located in Saline County with nearby schools including Caldwell Elementary School, Benton Middle School, and Benton Junior High School.
Ownership History
Date
Name
Owned For
Owner Type
Purchase Details
Closed on
May 20, 2016
Sold by
Edmondson Ronald H and Westbrook Bonnie C
Bought by
Robinson Kenneth R
Current Estimated Value
Home Financials for this Owner
Home Financials are based on the most recent Mortgage that was taken out on this home.
Original Mortgage
$83,361
Outstanding Balance
$64,716
Interest Rate
3.25%
Mortgage Type
FHA
Estimated Equity
$92,114
Purchase Details
Closed on
Mar 2, 2000
Bought by
Edmondson Trust
Create a Home Valuation Report for This Property
The Home Valuation Report is an in-depth analysis detailing your home's value as well as a comparison with similar homes in the area
Home Values in the Area
Average Home Value in this Area
Purchase History
| Date | Buyer | Sale Price | Title Company |
|---|---|---|---|
| Robinson Kenneth R | $84,900 | First National Title Co | |
| Edmondson Trust | -- | -- |
Source: Public Records
Mortgage History
| Date | Status | Borrower | Loan Amount |
|---|---|---|---|
| Open | Robinson Kenneth R | $83,361 |
Source: Public Records
Tax History
| Year | Tax Paid | Tax Assessment Tax Assessment Total Assessment is a certain percentage of the fair market value that is determined by local assessors to be the total taxable value of land and additions on the property. | Land | Improvement |
|---|---|---|---|---|
| 2025 | $1,067 | $24,839 | $3,080 | $21,759 |
| 2024 | $1,092 | $24,839 | $3,080 | $21,759 |
| 2023 | $642 | $24,839 | $3,080 | $21,759 |
| 2022 | $692 | $24,839 | $3,080 | $21,759 |
| 2021 | $641 | $18,340 | $2,200 | $16,140 |
| 2020 | $641 | $18,340 | $2,200 | $16,140 |
| 2019 | $641 | $18,340 | $2,200 | $16,140 |
| 2018 | $664 | $18,340 | $2,200 | $16,140 |
| 2017 | $1,014 | $18,340 | $2,200 | $16,140 |
| 2016 | $666 | $14,870 | $2,100 | $12,770 |
| 2015 | $659 | $14,870 | $2,100 | $12,770 |
| 2014 | $309 | $11,750 | $2,100 | $9,650 |
Source: Public Records
Map
Nearby Homes
- 216 Pike
- 121 Bass Ln
- 1212 Jackman St
- Lot 25 Lake St
- Lot 29R Lake St
- Lot 28 Lake St
- Lot 30R Lake St
- 517 Jefferson St
- Lot 2 Woodland
- 1500 W Sevier St
- 407 Robinette St
- 207 Dobbs St
- 1026 Whitewood Dr
- 1108 Ike St
- 1190 Cambridge Cir
- 1107 J Cove W
- 721 W Narroway St
- 521 W Cross St
- 408 W Sevier St
- 406 W Narroway St
Your Personal Tour Guide
Ask me questions while you tour the home.